LAST TRADING DAY of 2012
OK,
here we are at the edge of the cliff. WHO cares?
Price has been able to stayt above last week's Low of the week.
Who thinks we can see 1403 handle print today?
1403 is 50% of last week's range.
here we are at the edge of the cliff. WHO cares?
Price has been able to stayt above last week's Low of the week.
Who thinks we can see 1403 handle print today?
1403 is 50% of last week's range.
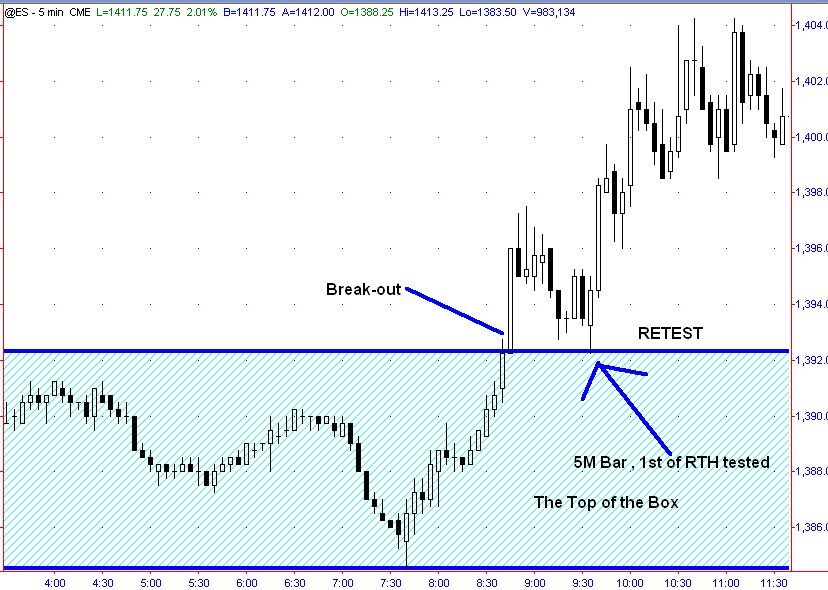
Here's a close-up showing the first bar of the RTH, believe me, whether you call it a test or a retest, it's worth paying attention to.
Even if you lack the intestinal fortitude to go long at the retest (the best place to try in my book), you could have tried to play the breakout above that 1397.50 B/O High print...It would be a 1-2-3 buy on a 5m scale (have patience with those). Sorry if my term seemed incorrect...
I'm not going to look at any more bar charts for the rest of the year.
And I mean that sincerely.
...There is a different bar that is calling me...
Emini Day Trading /
Daily Notes /
Forecast /
Economic Events /
Search /
Terms and Conditions /
Disclaimer /
Books /
Online Books /
Site Map /
Contact /
Privacy Policy /
Links /
About /
Day Trading Forum /
Investment Calculators /
Pivot Point Calculator /
Market Profile Generator /
Fibonacci Calculator /
Mailing List /
Advertise Here /
Articles /
Financial Terms /
Brokers /
Software /
Holidays /
Stock Split Calendar /
Mortgage Calculator /
Donate
Copyright © 2004-2023, MyPivots. All rights reserved.
Copyright © 2004-2023, MyPivots. All rights reserved.
