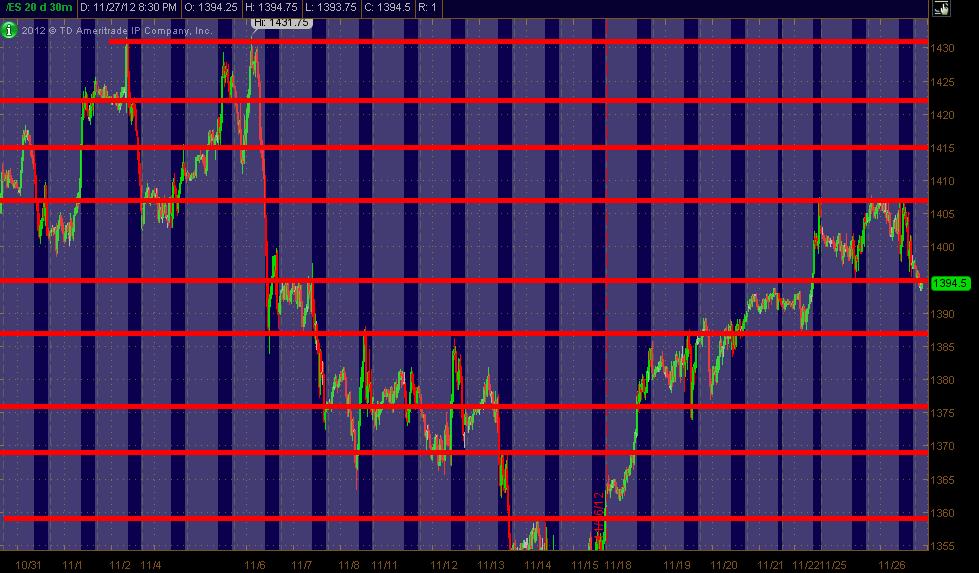
ES Wednesday 11/28/12
Here's my ES 30min chart "map" of potentially significant S/R levels in Red coming into Wednesday's trading. Just tossing it out as something to look at.
Hope this is helpful in some way for folks!
Hope this is helpful in some way for folks!
Great chart MM..seems like the battle will now be between the 1395 and the 1400...most days see two 60 minute bars trade at an extreme of the IB...so with that statistic I am leaning on the short side to go retest back down to 91.50..
we only had one bar pass through the 60 minute high so far ..more conservative traders will wait until we get back below mondays lows ( if we get back below there) to hunt for shorts
we only had one bar pass through the 60 minute high so far ..more conservative traders will wait until we get back below mondays lows ( if we get back below there) to hunt for shorts
Emini Day Trading /
Daily Notes /
Forecast /
Economic Events /
Search /
Terms and Conditions /
Disclaimer /
Books /
Online Books /
Site Map /
Contact /
Privacy Policy /
Links /
About /
Day Trading Forum /
Investment Calculators /
Pivot Point Calculator /
Market Profile Generator /
Fibonacci Calculator /
Mailing List /
Advertise Here /
Articles /
Financial Terms /
Brokers /
Software /
Holidays /
Stock Split Calendar /
Mortgage Calculator /
Donate
Copyright © 2004-2023, MyPivots. All rights reserved.
Copyright © 2004-2023, MyPivots. All rights reserved.
