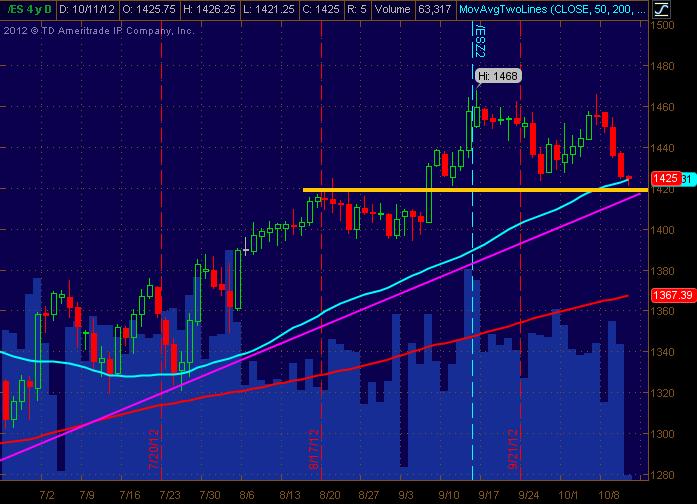
ES Thurs 10-11-12
The OBVIOUS on Daily ES chart ... a pullback into a tight ZONE of Support (yellow line), 50 Day SMA (cyan), and upward sloping Trendline (Magenta). Seems too obvious of a support area, but is worth watching thru that prism. The only contra to that is that there's a short term Double Top type formation at the same high from several years back. Didn't do anything xtra like fib analysis etc. But just wanted to post a bigger pic of what's going on hoping it helps ... just a "map" of things. Zone is 1415-1425 as potential support ... that could turn into a sideways trading range between 1425-1465. Next support zone down if broken looks like 1390-1395.
Earnings season and Thurs reports may well "jank" things around. Depending on the overnight session, I'm looking at buying calls fwiw.
Earnings season and Thurs reports may well "jank" things around. Depending on the overnight session, I'm looking at buying calls fwiw.
I don't like today's potential but here is what i am thinking about
I'm thinking that 1434.75 is the initial magnet..that is where all the volume entered from 8:30 reports..so if we can get any shorts on above that then we need to use that as a first target..the hardest part about short trades up here and towards yesterdays RTH highs is that the short covering can fuel quick rallies...on the positive side we have that VPOC from Tueday at 39.75...
above that I would be looking sell above 1442..mixed levels today are clouding the picture for me
above that I would be looking sell above 1442..mixed levels today are clouding the picture for me
that 34.75 test is part of my plan from up here on the short side..gonna take multiple stabs and keep it tight
Btw, no-go for me on any call buying due to the 10 point move up overnight and into the RTH open.
30.75 - 31.75 is only other magnet I have and On VPOC is there now too...other that that I am lost..I'd like to try small buys in that zone
wathcing closely to see if the 34.75 holds...then runners on short side are not gonna go far again
wathcing closely to see if the 34.75 holds...then runners on short side are not gonna go far again
1/2 gap fill is down there too in the 31 area..why can't this be easy ?
triple top with yesterdays highs and we spent first hour completely outside yesterdays VA high....so better to trade for IB high to break and be real careful on any fades outside of IB high
Nice call on that Bruce
tx sharks..38.75 has volume coming in so we can look for the fade with a signal but we need to keep in mind where that VPOC is too from Tuesday
Those options may work for you yet
we are approaching the second test of the death zone I mentioned in the video ..lets not forget where many of these zones come from...usually a previous days or weeks high or low...last weeks low is 1432.25.....so they are digesting that still...
personally I do not like the entire 33 - 29 area...just too many numbers showing up in there and I'm scaled way off here and will not try the long over lunch in here ..volume way off now too
we have gone just about equal amounts on both sides of the IB....so no good ideas for me
personally I do not like the entire 33 - 29 area...just too many numbers showing up in there and I'm scaled way off here and will not try the long over lunch in here ..volume way off now too
we have gone just about equal amounts on both sides of the IB....so no good ideas for me
Emini Day Trading /
Daily Notes /
Forecast /
Economic Events /
Search /
Terms and Conditions /
Disclaimer /
Books /
Online Books /
Site Map /
Contact /
Privacy Policy /
Links /
About /
Day Trading Forum /
Investment Calculators /
Pivot Point Calculator /
Market Profile Generator /
Fibonacci Calculator /
Mailing List /
Advertise Here /
Articles /
Financial Terms /
Brokers /
Software /
Holidays /
Stock Split Calendar /
Mortgage Calculator /
Donate
Copyright © 2004-2023, MyPivots. All rights reserved.
Copyright © 2004-2023, MyPivots. All rights reserved.
