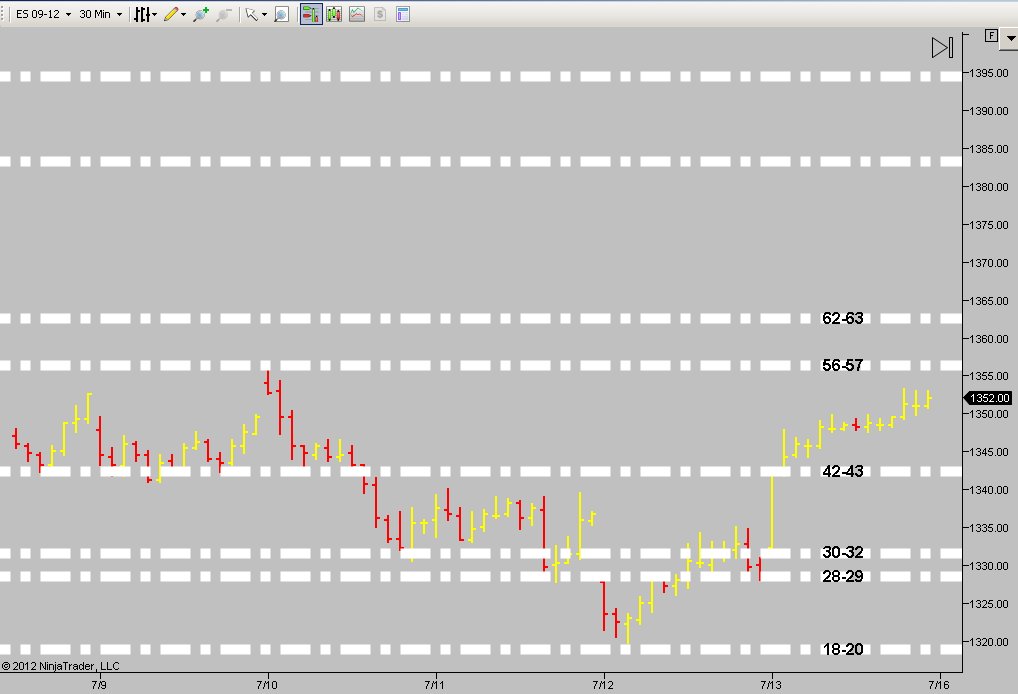
Chart for start of week 7/16
Here are my significant S/R levels going into the week. Have some other minor levels but this is the bulk of the framework. Good luck to all.
it definetely has potential....dxy trying a turnaround here which could help the move down
good trade bruce
see u tomorrow
see u tomorrow
thnx Nick...that little volume spike before 3 pm was telling me that maybe this was a fake out...then the delta flipped but it was still a bit lucky.....especially for that time of day
numbers for today wed 7/18:
above
56.25
60.5-61.5
66-67.5
below
50-52 (two gaps in the data on the 1m chart here)
43-43.5
38-39
good luck
above
56.25
60.5-61.5
66-67.5
below
50-52 (two gaps in the data on the 1m chart here)
43-43.5
38-39
good luck
we breezed thru the first two areas mentioned above but the 66-67.5 (which i also mentioned yesterday) has proved a bit stronger than the other two
i do believe the current high will not hold and 72.5-73.5 lies above for me as a shorting area
anyone else here? echo echo echo echo
i do believe the current high will not hold and 72.5-73.5 lies above for me as a shorting area
anyone else here? echo echo echo echo
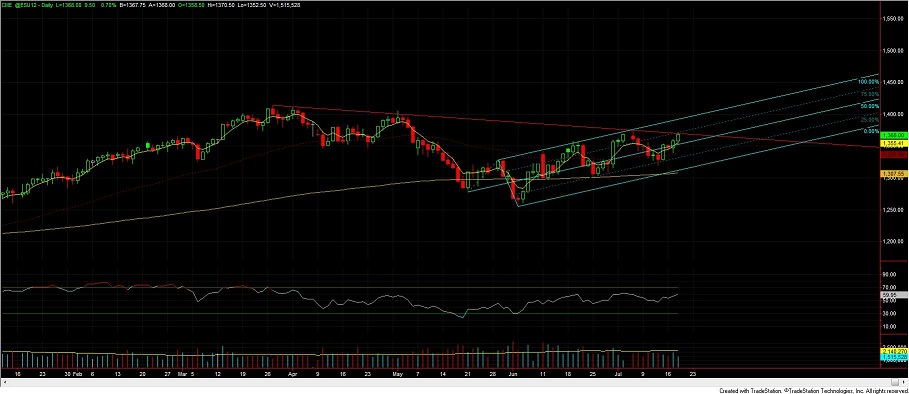
Several years ago there might have been respect for this trend line in red.......nowadays its more of a gamble.
The stretch rules....thank you hunter whereever you are.
The stretch rules....thank you hunter whereever you are.
Would you care to post in advance what you are looking for streach to do. In the past this was asked but never once did I see a real time post of streach levels and projections posted.
Bro....here's the model. This site is sooooooo dead.
This is the only site in the universe that actually gives you background and calcs the stretch on a daily basis.
Everthing thing moves in increments of its stretch. Its like pi is to the pyramids.
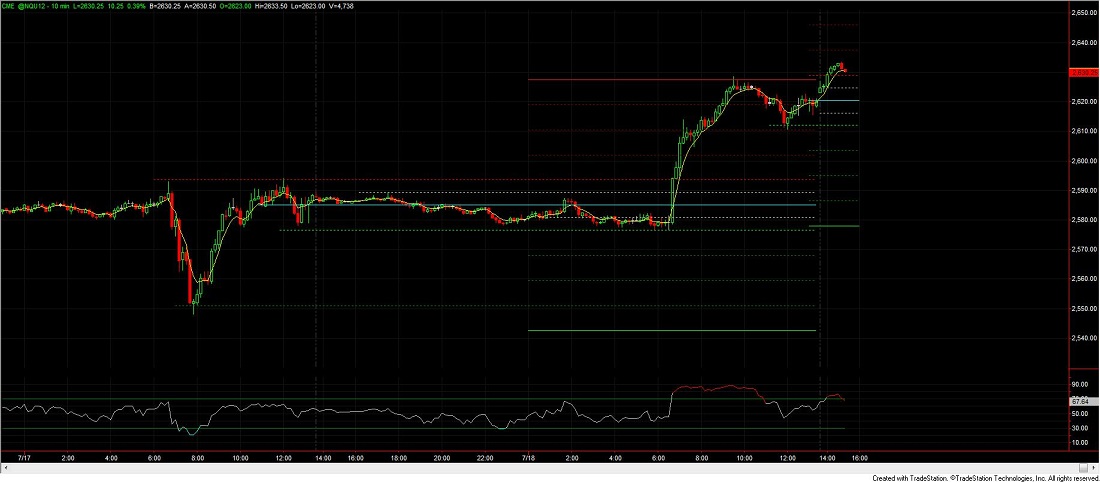
Here is an illustration of the base model for NQ....they're all the same BTW....NQ just has the best ROI.
Blue line = previous close
Lower green = stretch support
Upper Red = stretch resistance
All lines are increments of the stretch.
Sorry but I was not aware that there is a stretch calculation daily on this site. Can some one pls point me to it
Its in the detail of daily notes section......
It has it for every traded instrument in the universe....almost...
And if it isn't listed there it will calc it for you.
Just as an observation .....the market is in the third of the "three drives" pattern....recovery from the May sell-off.
It has it for every traded instrument in the universe....almost...
And if it isn't listed there it will calc it for you.
Just as an observation .....the market is in the third of the "three drives" pattern....recovery from the May sell-off.
Originally posted by rburns
Sorry but I was not aware that there is a stretch calculation daily on this site. Can some one pls point me to it
http://www.mypivots.com/dailynotes
Emini Day Trading /
Daily Notes /
Forecast /
Economic Events /
Search /
Terms and Conditions /
Disclaimer /
Books /
Online Books /
Site Map /
Contact /
Privacy Policy /
Links /
About /
Day Trading Forum /
Investment Calculators /
Pivot Point Calculator /
Market Profile Generator /
Fibonacci Calculator /
Mailing List /
Advertise Here /
Articles /
Financial Terms /
Brokers /
Software /
Holidays /
Stock Split Calendar /
Mortgage Calculator /
Donate
Copyright © 2004-2023, MyPivots. All rights reserved.
Copyright © 2004-2023, MyPivots. All rights reserved.


