ES Monday 3-26-12
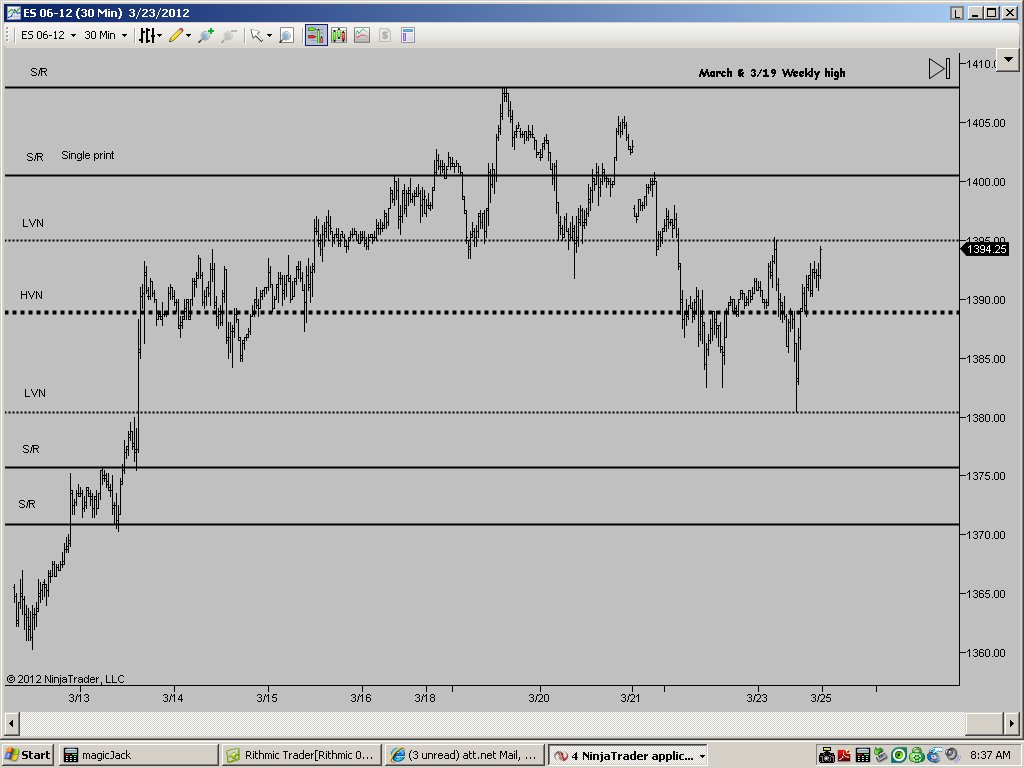
Remember to scroll the chart to the left to see what the lines represent.
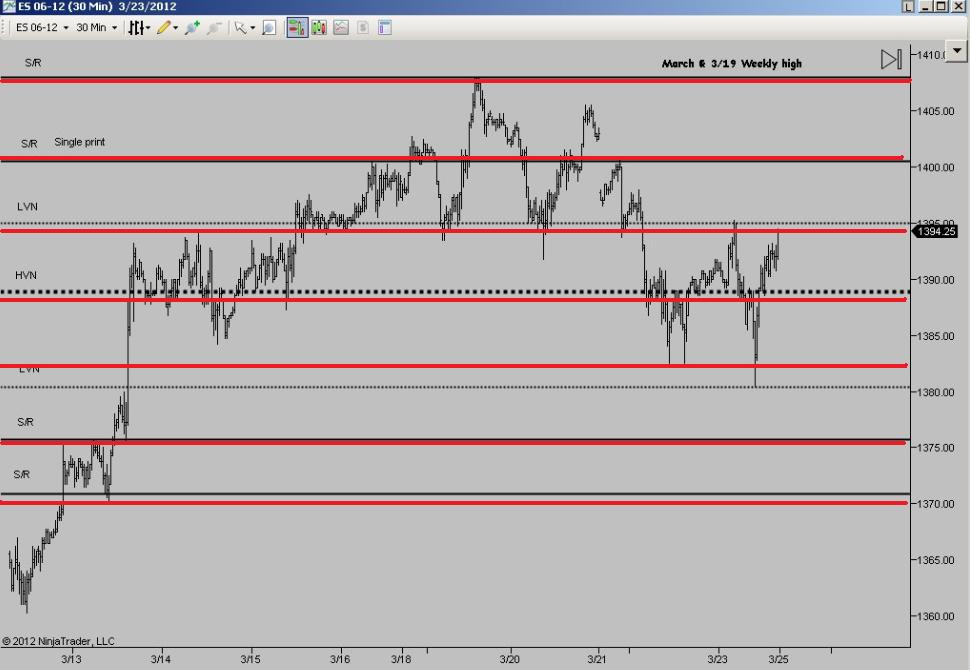
Just thought I'd use Big Mike's chart posted above and add price level lines in Red. Based on my price S/R levels, most line up with his. Doing this simply as an exercise in combining analysis from 2 points of view that have overlap. Figured it'd be fun and maybe educational for folks. Make sure to scroll Mike's chart (as DT mentioned) to the left to see his labels on the level's he's drawn in.
I'm also listing the price levels below the chart with rationale for where/how they're derived. My part ain't rocket science ... as I've always said.
And here are the price level "explanations," for lack of a better word.
1408 S/R and Wkly Pvt
1399-1401 S/R and Daily Floor Pvt R1 and Daily DeMark R1 and Wkly DeMark R1
1394 S/R and Wkly Mid Pvt
1388-1389 S/R and Daily Floor Mid Pvt and Daily DeMark S1
1382 S/R
1375 S/R and Daily Floor Pvt S2
1369-70 S/R
MM
ps. Might be fun to keep adding to this chart with other folks analysis, more MP, VP, Fibs etc ... just a Monkey Idea.
great stuff....looking at 98 - 97 as the magnet but that will require that the O/N high holds in RTH..
staring sells at 03.25 but prefer to see 04.75 print still..aggressive as $ticks cummulative haven't rolled over yet
going flat as no profit and report in 4 minutes...too close
Just a quick note for everybody (only becasue price is so close)
I keep track fo the Monthly pivot points (based on RTH only),
I have noticed (from studying charts that have the monthly pivots on them) that more often than not, the first test of the monthly R2 is rejected (very playable)
Monthly R2 is 1407.50
Price hit it last week and reacted all the way back to 1380.25.
However, buyers reasserted themselves.
Price is so close to the monthly R2 ( last week H was 1408.00, that was first test), anyway, price is so close that it would be perfectly natural to test that 1407.50-1408.00 level again.
if price blasts through it, then longer term time frame breakout players are buying. (price could come back and test the breakout point but if it goes above the high of the first breakout, squeeze de la squeeze
If price gets there and goes sideways, fear of heights is affecting the market and a return to test Friday's H might unfold.
There is nothing that I see right now that suggests either way (although that 1407-1408 is an immediate magnet for me), once that is tested (IF it is tested) have to watch price reaction.
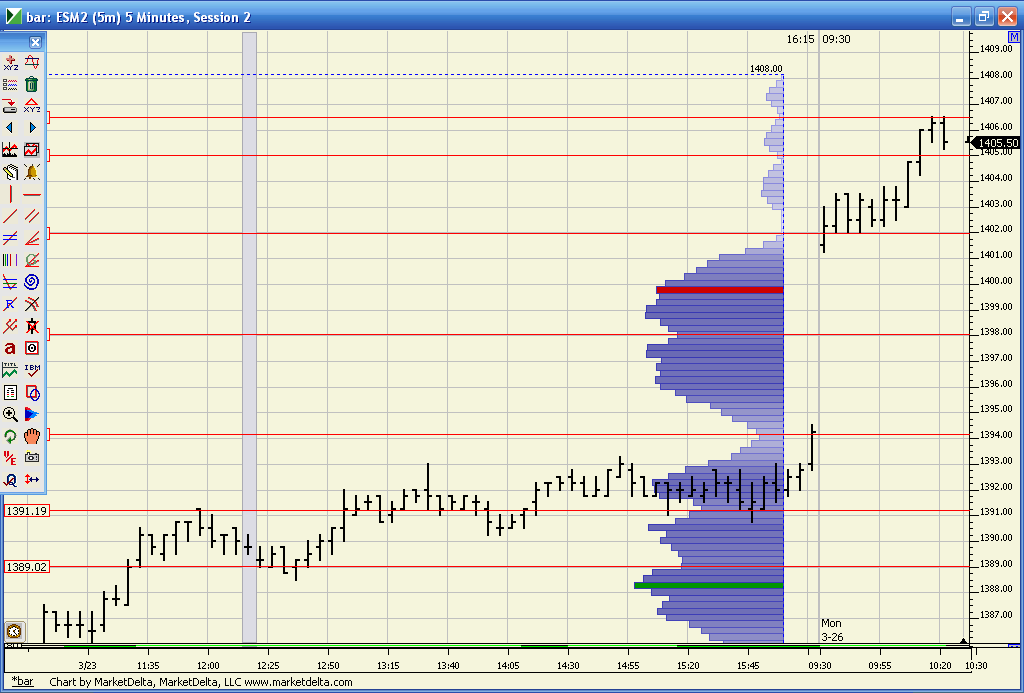
s 1406.50 print .weekly R1 is at 06.50 and a minor low volume spot. still this is aggressive as we held top of bigger bell curve at today lows!
2 air pockets below! will watch to see if they get an hour close above last weeks highs for risk
2 air pockets below! will watch to see if they get an hour close above last weeks highs for risk
trying to get to 04.75 retest..volume building at 06.50 now...
a look at why these fades are even higher risk..note how the current days low has held as support right above the bigger bell curve in that low volume spot
RE the weekly R2, I have 1408.00 as the weekly R2 (using formula for Woodie's PP available right here in the daily notes) Woodie's as defned in mypivots and classic pivot points calcs are equal for PP R1, R2, S1, S2, it is only past S2 and past R2 that calcs differ.
There has to be some sort of natural buying going on It is so hard for me to believe that there are any UN-squeezed bears left after Friday's lift from the 50% level of the prior week (1380.25 was 50% of the week ending 3-16-12)
There has to be some sort of natural buying going on It is so hard for me to believe that there are any UN-squeezed bears left after Friday's lift from the 50% level of the prior week (1380.25 was 50% of the week ending 3-16-12)
Thanks Bruce!
Emini Day Trading /
Daily Notes /
Forecast /
Economic Events /
Search /
Terms and Conditions /
Disclaimer /
Books /
Online Books /
Site Map /
Contact /
Privacy Policy /
Links /
About /
Day Trading Forum /
Investment Calculators /
Pivot Point Calculator /
Market Profile Generator /
Fibonacci Calculator /
Mailing List /
Advertise Here /
Articles /
Financial Terms /
Brokers /
Software /
Holidays /
Stock Split Calendar /
Mortgage Calculator /
Donate
Copyright © 2004-2023, MyPivots. All rights reserved.
Copyright © 2004-2023, MyPivots. All rights reserved.


