ES Thursday 3-1-12
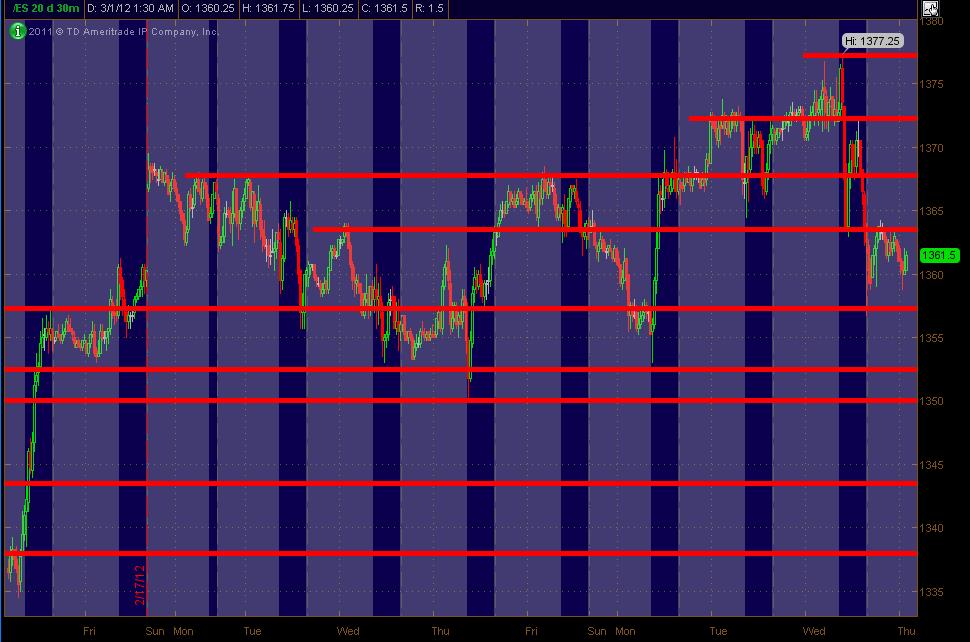
Here's what I'm seeing as PASR (Support/Resistance) ZONES for the ES using a 30min chart as a "map" coming into Thursday's trading. The Gray background shows the trading outside of the RTH session, with the Blue background being the RTH activity. Hope some find this helpful as they incorporate their own strategeries throughout the trading day!
Click image for original size
yesterday was an OVB to the downside with good volume on the dailies....usually we see SOME downside follow through
I don't see that DUCK just looking at day session data...I look at the 5 minute bars to find them
What zones are you looking at below BruceM ? Many thanks.
the gap i see at 136350 is in o\n at 405am on 5 min chart
I still like 59 - 61 downside as a potential long trade but not a target..but I'm asking myself this:
What is it going to take to break away from this 68 volume? So I'm just not sure if we will even get down that far .
In general traders will try to sell high and buy low ASSUMING 68 will pull price back but at some point the band of volatility will snap and we will trend away...that is always the risk and hard part but that doesn't usually happen inside the 90 minute window...
I never studied O/N gaps in the data...low volume will usually produce many of them
Originally posted by duck
the gap i see at 136350 is in o\n at 405am on 5 min chart
To Bruce, will you consider the statistic for the IB (95% chance of a break) if so to which direction this 95% going to happen?
this is my developing weekly profile...we have two peaks, 70.5 and 67.5-68, with a valley showing at 69...until we get carried away with volume above 70.5 or below 67.5-68 we are gonna ping pong between the two filling that 69ish level that bruce mentioned yesterday (or the day before) that will round the bell curve
http://www.sierrachart.com/userimages/upload_2/1330618221843.png
http://www.sierrachart.com/userimages/upload_2/1330618221843.png
Great visual Nick of what probably needs to fill in a bit more
look at that..right back to our 68...without me but who cares ? Hopefully anyone new or struggling should study Nicks chart and think more about CONTEXT...read the work of Bret Steenbarger here http://www.traderfeed.blogspot.com/
if you doubt what anyone says here than maybe after much review you may realize that many good trades start with the TARGET in mind FIRST. It isn't always easy to trade for final targets but often you will be able to take a piece out of the journey back down ( or up) to magnet prices
if you doubt what anyone says here than maybe after much review you may realize that many good trades start with the TARGET in mind FIRST. It isn't always easy to trade for final targets but often you will be able to take a piece out of the journey back down ( or up) to magnet prices
Emini Day Trading /
Daily Notes /
Forecast /
Economic Events /
Search /
Terms and Conditions /
Disclaimer /
Books /
Online Books /
Site Map /
Contact /
Privacy Policy /
Links /
About /
Day Trading Forum /
Investment Calculators /
Pivot Point Calculator /
Market Profile Generator /
Fibonacci Calculator /
Mailing List /
Advertise Here /
Articles /
Financial Terms /
Brokers /
Software /
Holidays /
Stock Split Calendar /
Mortgage Calculator /
Donate
Copyright © 2004-2023, MyPivots. All rights reserved.
Copyright © 2004-2023, MyPivots. All rights reserved.