ES Monday 2-6-12
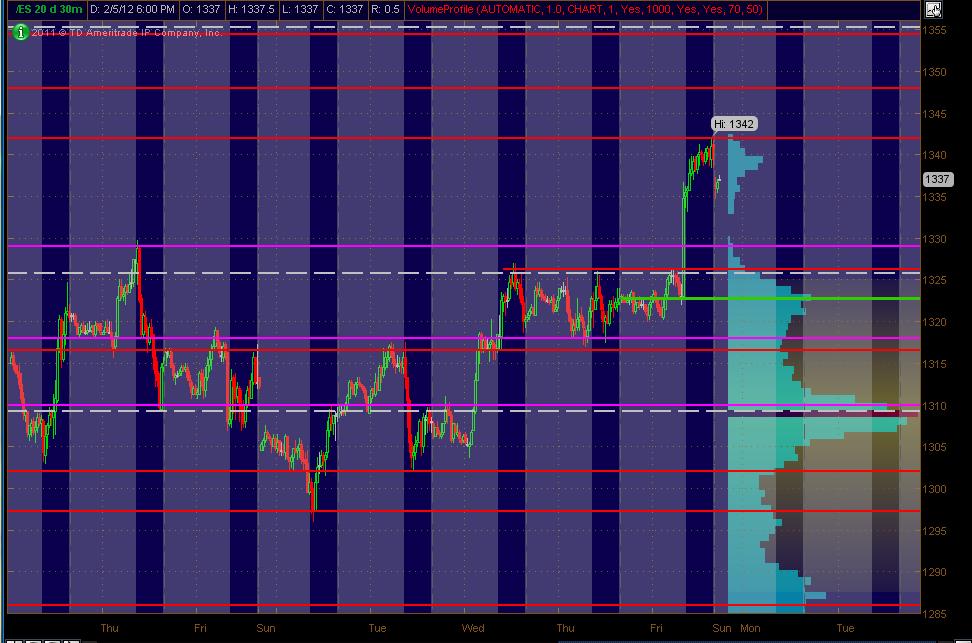
Here's what I've got for my ES MAP of PASR ZONES using a 30min chart of 20 days of data coming into Monday's trading. The Red lines are potential significant levels with Magenta lines as semi-significant. The Green line is the close on Thursday which is the GAP based on the opening on Friday (unclosed obviously). The White dashed lines are the Weekly Pivots (kind of a background thing to have on the chart). The Light Blue Volume Profile of the past "rolling" 20 days is displayed on the right vertical axis. Btw, price lines that are CLOSE together (within a couple of points of so), should be taken as an overall ZONE. The Gray background shows non-RTH price activity. Hope, as always, that this is helpful to some as a "MAP."
This spans roughly 100 ES points on the chart. More scattered lines than I'd like to have typically, but here's what I'm looking at as significant areas:
1354.50-1355.25 PASR / Wkly Pvt / .619 Fib Extension as per mypivots
1348 PASR / RTH Daily S2 / ATH Daily S1
1326 PASR / Wkly Pvt
(1322.75) gap close from Friday - the green line
1316.50-1318 PASR ZONE / DeMark Wkly S1
[The magenta line at 1329 is on the chart and worth mentioning ... but only in passing, as I don't see this as offering much support other than being the "beginning" of an overall BIGGER support ZONE, fwiw]
Click image for original size
This spans roughly 100 ES points on the chart. More scattered lines than I'd like to have typically, but here's what I'm looking at as significant areas:
1354.50-1355.25 PASR / Wkly Pvt / .619 Fib Extension as per mypivots
1348 PASR / RTH Daily S2 / ATH Daily S1
1326 PASR / Wkly Pvt
(1322.75) gap close from Friday - the green line
1316.50-1318 PASR ZONE / DeMark Wkly S1
[The magenta line at 1329 is on the chart and worth mentioning ... but only in passing, as I don't see this as offering much support other than being the "beginning" of an overall BIGGER support ZONE, fwiw]
Those rock !!!!!!!
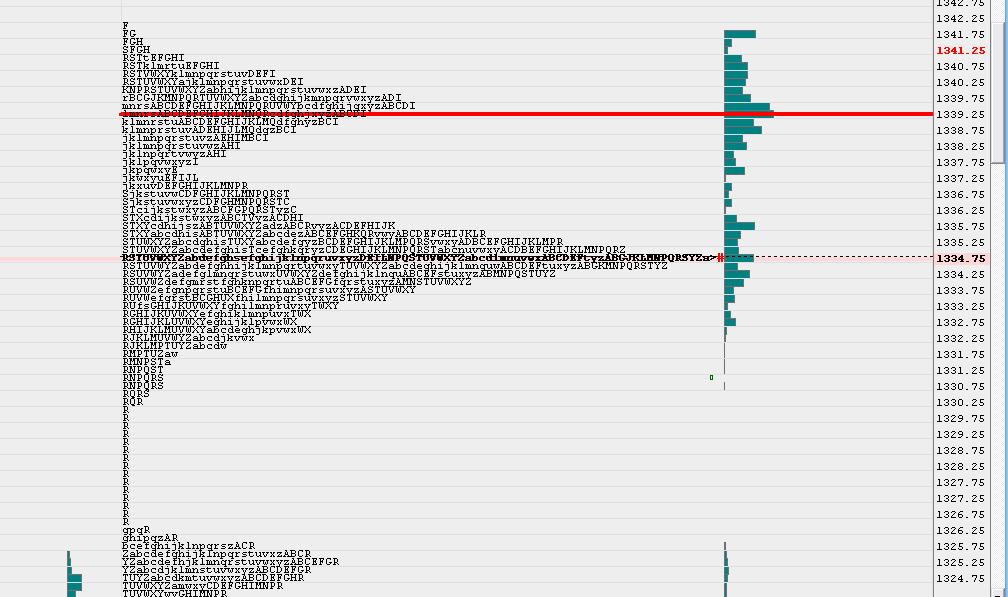
numbers I'm using as we approach Mondays open trade
1342 - 1344 Fridays highs and rat
1350 key rat
1355 - 1356 Weekly R1 and Rat
numbers below are based off of chart points...will post video links for explanations
1334 - 1336
1329 - 1330
1325 - 1327 weekly pivot here too
1322.50 **** big volume
1314.75 - 1317
1307 - 1309 big volume and weekly S1
1342 - 1344 Fridays highs and rat
1350 key rat
1355 - 1356 Weekly R1 and Rat
numbers below are based off of chart points...will post video links for explanations
1334 - 1336
1329 - 1330
1325 - 1327 weekly pivot here too
1322.50 **** big volume
1314.75 - 1317
1307 - 1309 big volume and weekly S1
bruce, i am surprised you are not including the 39.25-39.5 high vol from friday. Any reason why ?
Originally posted by BruceM
numbers I'm using as we approach Mondays open trade
1342 - 1344 Fridays highs and rat
1350 key rat
1355 - 1356 Weekly R1 and Rat
numbers below are based off of chart points...will post video links for explanations
1334 - 1336
1329 - 1330
1325 - 1327 weekly pivot here too
1322.50 **** big volume
1314.75 - 1317
1307 - 1309 big volume and weekly S1
I'm rushing around now Nick..trying to get some video posted ...sorry.just forgot it..here is a visual of the key numbers
Click image for original size
no problem bruce, did not mean to rush you or anything... was wondering if there was any reason at all...thanks for the update, as usual
Originally posted by BruceM
I'm rushing around now Nick..trying to get some video posted ...sorry.just forgot it..here is a visual of the key numbers
Click image for original size
Click image for original size

s 38.25...good odds 36.50 will get tested again
hopefully not too early as there are plenty who want that 39 to print
flat at 35...don't trust open print with that 34 area nearby
John...that 38.75 if it prints is Fridays vwap too..
John...that 38.75 if it prints is Fridays vwap too..
sure seems like they want to just fill in the 36 - 37 area.....I'm sticking with extremes and will wait to see what happens if they run the hour extremes...till then not much to do
Click image for original size
Emini Day Trading /
Daily Notes /
Forecast /
Economic Events /
Search /
Terms and Conditions /
Disclaimer /
Books /
Online Books /
Site Map /
Contact /
Privacy Policy /
Links /
About /
Day Trading Forum /
Investment Calculators /
Pivot Point Calculator /
Market Profile Generator /
Fibonacci Calculator /
Mailing List /
Advertise Here /
Articles /
Financial Terms /
Brokers /
Software /
Holidays /
Stock Split Calendar /
Mortgage Calculator /
Donate
Copyright © 2004-2023, MyPivots. All rights reserved.
Copyright © 2004-2023, MyPivots. All rights reserved.