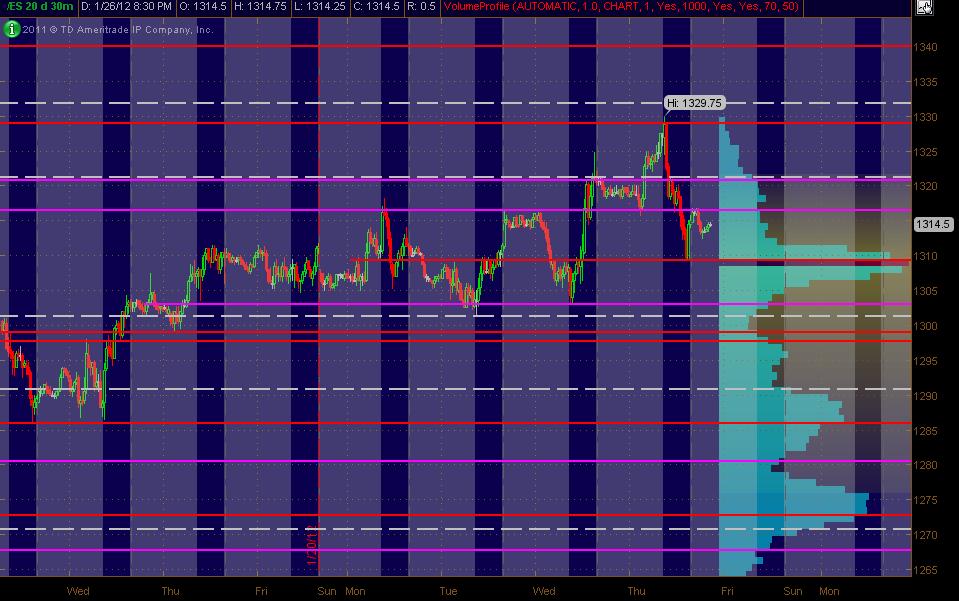
ES Friday 1-27-12
Here's what I've got for my ES MAP of PASR ZONES using a 30min chart of 20 days of data coming into Friday's trading. The Red lines are potential significant levels with Magenta lines as semi-significant. The White dashed lines are the Weekly Pivots (kind of a background thing to have on the chart). The Light Blue Volume Profile of the past "rolling" 20 days is displayed on the right vertical axis. Btw, price lines that are CLOSE together (within a couple of points), should be taken as an overall ZONE. The Gray background shows non-RTH price activity. Hope, as always, that this is helpful to some as a "MAP."
Great vid and clear, cogent explanation including some nuances Bruce. Good stuff! Waiting for the comprehensive and complete 10-DVD course to surface combining your implementation of:
Volume Profile (LVNs HVNs)
Pit Bull
"M" & "W" patterns (and the count)
First 1-minute range usage
Initial balance
Triples
Air
Gaps on 1 and 5 min chart(s)
Overnight Hi / Lo
Midrange (50% Retracements)
Interpreting 1-minute bar Volume "reading"
"Rats" (and other significant rodent levels)
Current MP usage (POC, single prints etc.)
Incorporating Nyse TICK behavior
Etc.
HA!
Have a cool weekend with our friend Johnny Walker dude!
Btw, how do you swim in a frozen pool??!??
ps. Don't forget to share your fav FIB #'s
MM
Oh yeah, ya gotta score it yourself with some sweet guitar acoustic background soundscapes!
Emini Day Trading /
Daily Notes /
Forecast /
Economic Events /
Search /
Terms and Conditions /
Disclaimer /
Books /
Online Books /
Site Map /
Contact /
Privacy Policy /
Links /
About /
Day Trading Forum /
Investment Calculators /
Pivot Point Calculator /
Market Profile Generator /
Fibonacci Calculator /
Mailing List /
Advertise Here /
Articles /
Financial Terms /
Brokers /
Software /
Holidays /
Stock Split Calendar /
Mortgage Calculator /
Donate
Copyright © 2004-2023, MyPivots. All rights reserved.
Copyright © 2004-2023, MyPivots. All rights reserved.
