ES Thursday 19/Jan/2012
My apologies if I stepped on someone's thread starting turf....
Everyone's not only watching the ascending triangle, but the obvious tl's as well.
Can anyone provide MP notes on obvious stops above the tl on a breakout?

Everyone's not only watching the ascending triangle, but the obvious tl's as well.
Can anyone provide MP notes on obvious stops above the tl on a breakout?

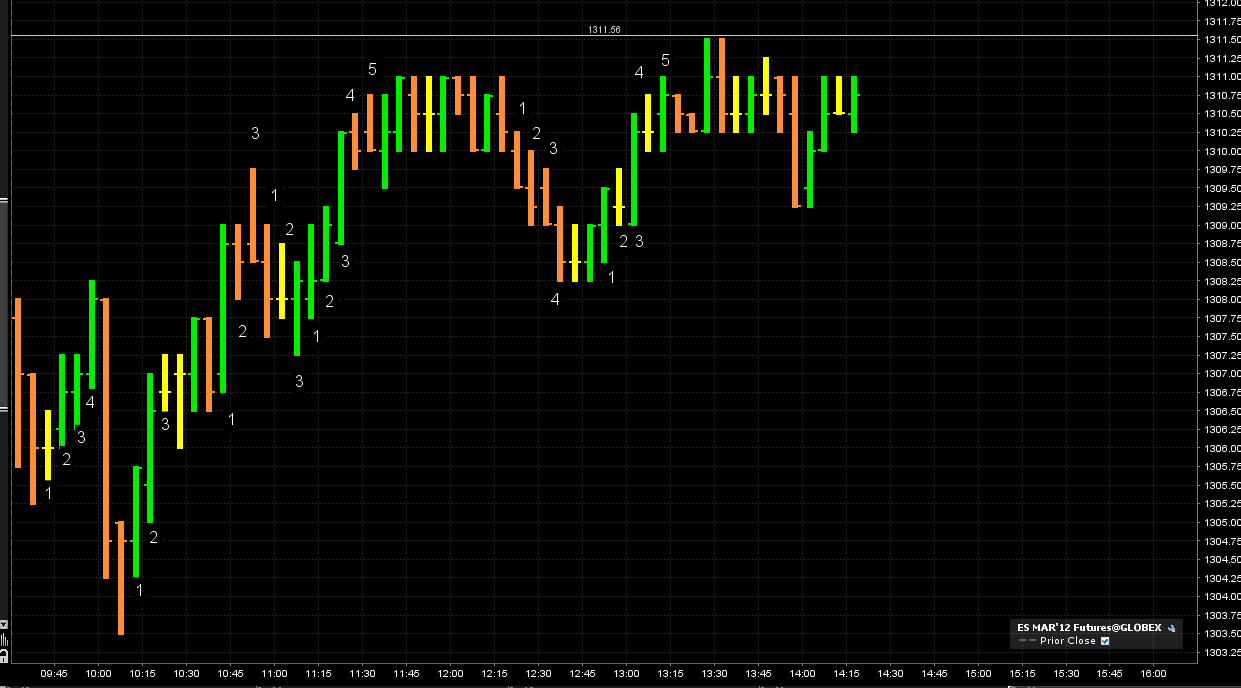
here are the segment counts from today so far( yes i am bored out of my mind right now..ha) ..hopefully somebody will undertsnad what happens after 3 - 5 higher highs or lower lows....basically after three in a row the 4 th or 5th bar go nowhere...anyway here is what it looks like today....they must be consecutive to qualify...
smart minds here will use it to their advantage...
I had a nice buy at the 08.50 earlier after we had four lower lows and I had a volume spike ( look at your one minute volume spike areas for that) at the 09 area....I was unable to hold for the new highs as I saw those triples form and covered too early...anyway that is just an example...u may find ways to use it better than that..
glad u appreciate it Nick
Bruce, funny i also bot that 1208.5 as it became a .38% retrace for about 3pts
yeah..also the IB high is there...lot happening there...even vwap was down there at 07.50 on that last dip
bruce, the 3rd one at around 1pm doesn't seem to be consecutive right? it is an EL (equal low) and you need a HL in this case; if you are coutning HHs then it looks fine but in your previous post i thought you mentioned HLs and LHs as prerequisites; we obviously can have a bar with a HL that does not necessarily have a HH and vice versa
can you clarify which is the requisite? thanks
can you clarify which is the requisite? thanks
Originally posted by BruceM
here are the segment counts from today so far( yes i am bored out of my mind right now..ha) ..hopefully somebody will undertsnad what happens after 3 - 5 higher highs or lower lows....basically after three in a row the 4 th or 5th bar go nowhere...anyway here is what it looks like today....they must be consecutive to qualify...
smart minds here will use it to their advantage...
I had a nice buy at the 08.50 earlier after we had four lower lows and I had a volume spike ( look at your one minute volume spike areas for that) at the 09 area....I was unable to hold for the new highs as I saw those triples form and covered too early...anyway that is just an example...u may find ways to use it better than that..
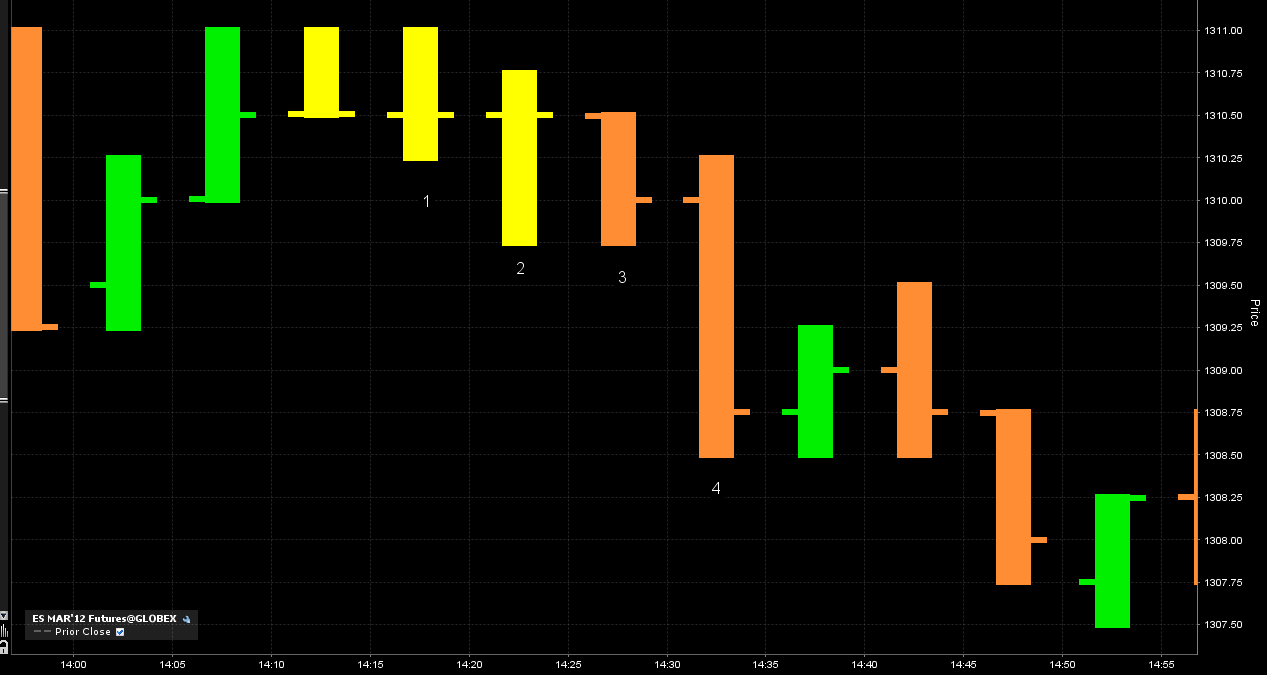
Nick ..it could be and equal low as long as it is a higher high...sorry if that wasn't clear..another good example is about 2:15 on the downside......we had an equal high but a lower low...so that is bar 1 on the segment count down....here is how that looked...note the pause after bar number 4...
once again my mentor used this on the big contract so we need a bit of discretion on the emini...let me know if that makes sense..
once again my mentor used this on the big contract so we need a bit of discretion on the emini...let me know if that makes sense..
so in your last example bar 3 is also good because although it is an EL it does show a LH right? if so, then it is clear...thanks
Originally posted by BruceM
Nick ..it could be and equal low as long as it is a higher high...sorry if that wasn't clear..another good example is about 2:15 on the downside......we had an equal high but a lower low...so that is bar 1 on the segment count down....here is how that looked...note the pause after bar number 4...
once again my mentor used this on the big contract so we need a bit of discretion on the emini...let me know if that makes sense..
correct..in a down trend you basically want to see a lower high or and equal high with a lower low...in and uptrend you want to see an higher low or a equal low with a higher high
you got it...we can also think of pure time...so they will push for 15- 20 minutes in one direction but then need to take a break....that break leads to reversals or just a pause before pushing further in the same direction...as usualy we can see what happens when the pushes end up at key areas...this shows the smart money is buying or selling ahead of a number and exiting when the number hits
you got it...we can also think of pure time...so they will push for 15- 20 minutes in one direction but then need to take a break....that break leads to reversals or just a pause before pushing further in the same direction...as usualy we can see what happens when the pushes end up at key areas...this shows the smart money is buying or selling ahead of a number and exiting when the number hits
Emini Day Trading /
Daily Notes /
Forecast /
Economic Events /
Search /
Terms and Conditions /
Disclaimer /
Books /
Online Books /
Site Map /
Contact /
Privacy Policy /
Links /
About /
Day Trading Forum /
Investment Calculators /
Pivot Point Calculator /
Market Profile Generator /
Fibonacci Calculator /
Mailing List /
Advertise Here /
Articles /
Financial Terms /
Brokers /
Software /
Holidays /
Stock Split Calendar /
Mortgage Calculator /
Donate
Copyright © 2004-2023, MyPivots. All rights reserved.
Copyright © 2004-2023, MyPivots. All rights reserved.

