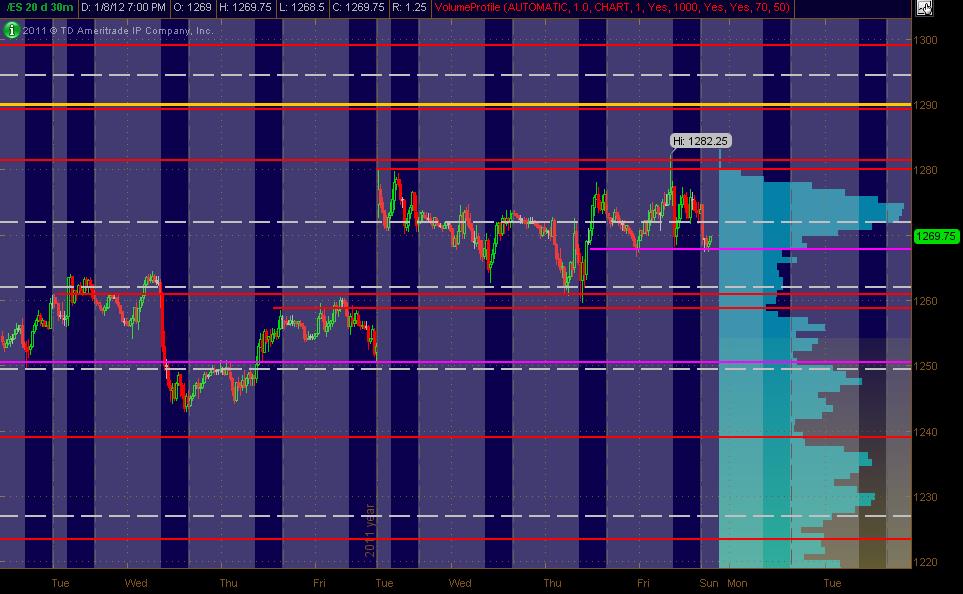
ES Monday 1-9-12
Here's what I've got for my ES MAP of PASR ZONES using a 30min chart of 20 days of data coming into Monday's trading. The Red lines are potential significant levels with Magenta lines as semi-significant. The White dashed lines are the Weekly Pivots. Have one Yellow line for a Fib cluster fwiw. The Light Blue Volume Profile of the past "rolling" 20 days is displayed on the right vertical axis. The Gray background shows non-RTH price activity. Hope, as always, that this is helpful to some as a "MAP."
Primary price levels/zones I'm looking at:
1289-90 PASR level / Daily R2 (RTH calcs and others) / Fib cluster
1280-82 PASR Zone / Daily R1
1274-75 Daily Mid Pvt (all trading hours) / VolProfile HVN on 20 day “rolling” and on 1 and 2 day as well
1259-61 PASR Zone
1250 Minor PASR / Wkly Pvt
Bruce posted a chart showing a well-shaped bell curve (MP I think) ... and looking at the daily ES chart shows the old fashioned "ascending triangle" (for now). The idea being that a strong push out of this area is likely (up or down), but based on the multi-frame chart patterns and price action ... for me, tends to favor a break to the upside within a day or few this week. Just my "read" for now.
flat now......just a warning that those initiating right at all this volume 72 - 75 will have harder trades....best to fade moves away from all that volume as per my post #1 today
Obviously you have mastered es trading.
thanks for the compliment...some days it still masters me but that is needed to keep me humble and to keep learning new things about myself and my abilities...
cool how we traded on both sides of the IB ( neutral day ) and after second break they went back to the middle of the range....
what prices do you have fot IB sofar today
71.25 and 76.75..
this is like watching grass grow
Yeah kinda quiet ... like the calm before a storm. Since the fast rally beginning with that big UP day on 12/20, we shot from 1200 to 1260 and consolidated pretty tightly (hardly a pullback) on the daily chart. Then gapped up on 1/3, pretty much filled the gap as we've consolidated in the 1260-80 range with lots of overlap of the daily bars. No one is selling this back down. Seems like strength to me.
Plus there's that ascending triangle on the daily where price is up near the top of the formation. It's basic TA 101 I realize, but a breakout leg-up could be in the makings. Then again, everyone and their dog sees it, so maybe it's not as solid - but it sure feels that way. Just some 2 cents from a monkey.
If it happens, it should initially target 1290 and then 1300 imho ... so perhaps 20+ points or more to the upside.
Maybe!
Emini Day Trading /
Daily Notes /
Forecast /
Economic Events /
Search /
Terms and Conditions /
Disclaimer /
Books /
Online Books /
Site Map /
Contact /
Privacy Policy /
Links /
About /
Day Trading Forum /
Investment Calculators /
Pivot Point Calculator /
Market Profile Generator /
Fibonacci Calculator /
Mailing List /
Advertise Here /
Articles /
Financial Terms /
Brokers /
Software /
Holidays /
Stock Split Calendar /
Mortgage Calculator /
Donate
Copyright © 2004-2023, MyPivots. All rights reserved.
Copyright © 2004-2023, MyPivots. All rights reserved.
