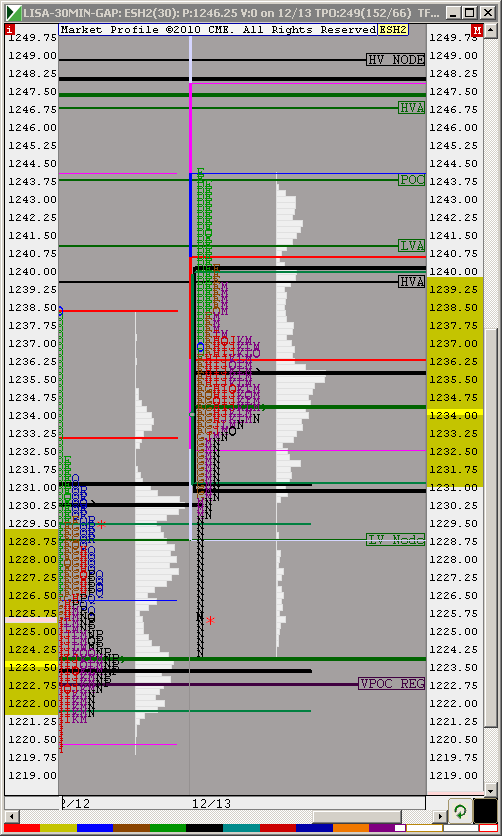
ES Tuesday 12-13-11
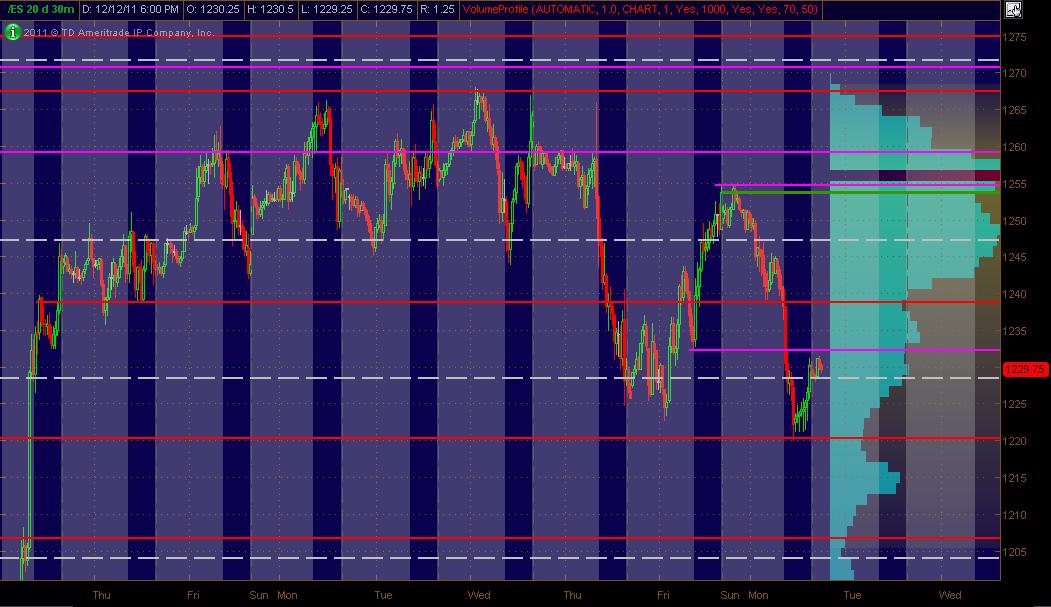
Here's what I've got for my ES MAP of PASR ZONES using a 30min chart of 20 days of data coming into Tuesday's trading. The Red lines are potential significant levels with Magenta lines as semi-significant. The White dashed lines are the Weekly Pivots. The Green line is an unclosed gap level. The Light Blue Volume Profile of the past "rolling" 20 days is displayed on the right vertical axis. The Gray background shows non-RTH price activity. Hope, as always, that this is helpful to some as a "MAP."
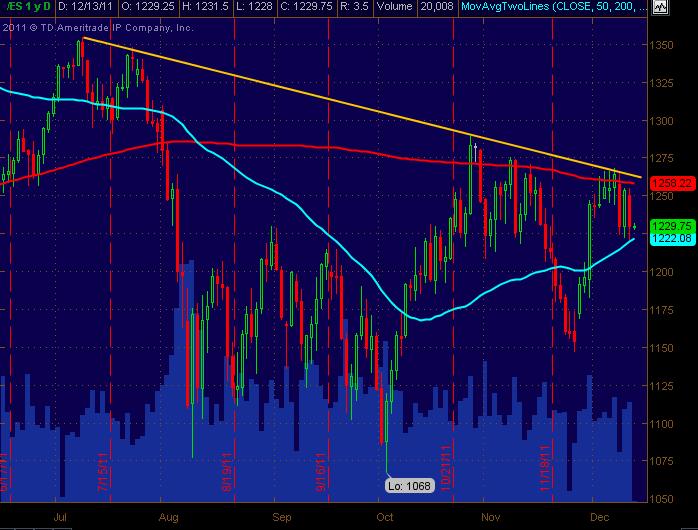
And here's the All Trading Hours Daily (continuous contract) for the ES. We've had some WR days with the 200sma and 50sma containing price as they're converging, fwiw ... with the Yellow down trend line still intact. Just a bigger view to combine visually with the 30min PASR chart for better analysis.
MM
fed day now Lisa...u play and u will pay !!!
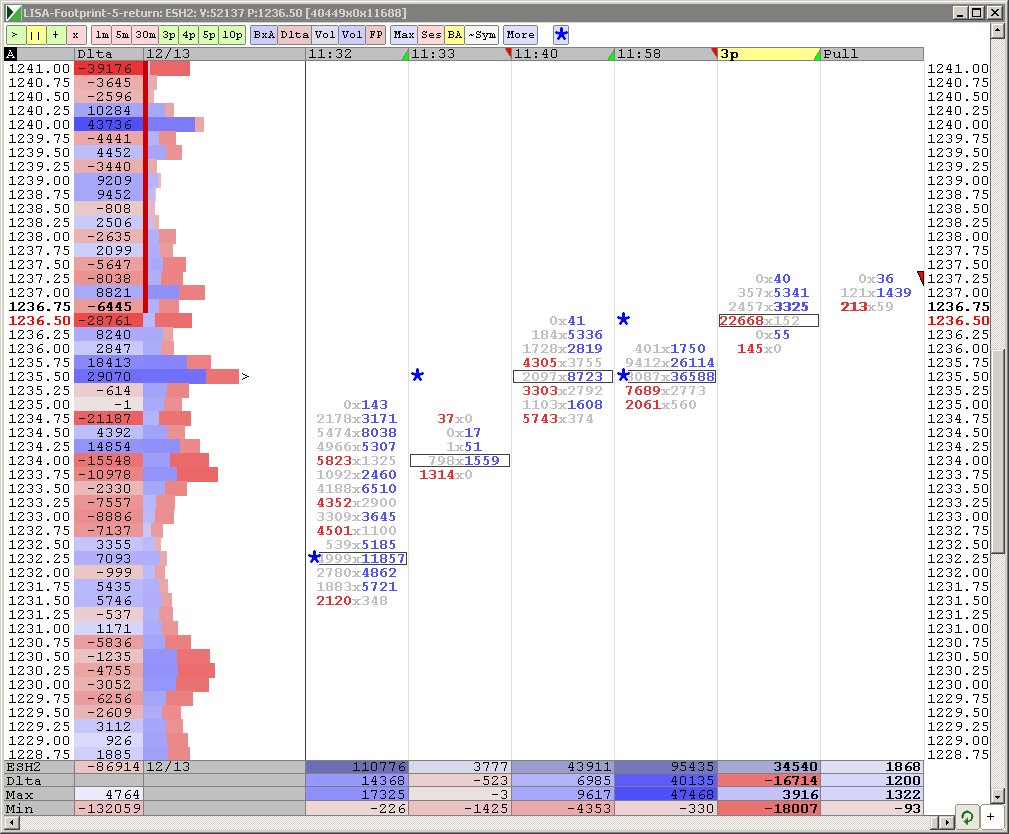
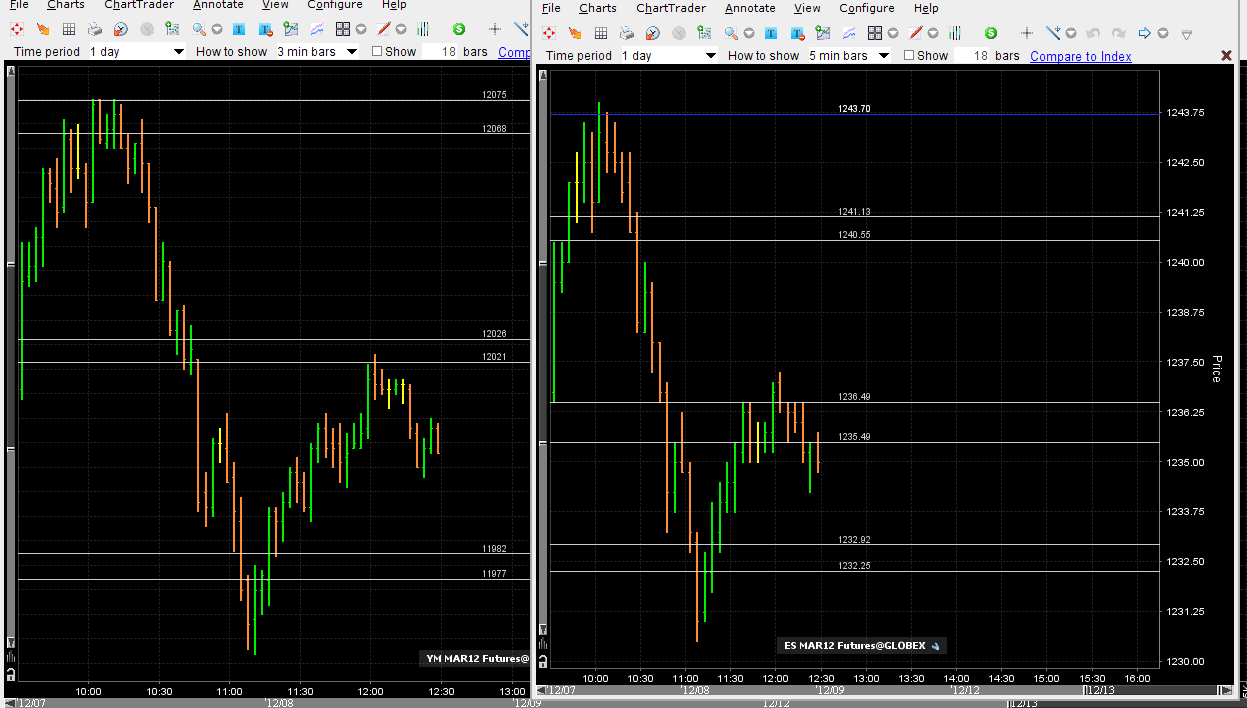
A picture of why it was a good day for me but the real message is that the best trades will happen when you have both the YM and ES hitting into their zones at the same time. Note how the 40 - 41 area on the ES had no matching YM zone to work from as a good example.
Perhaps YOUR reseach will show that it would be best to avoid zones that don't match up.
Perhaps YOUR reseach will show that it would be best to avoid zones that don't match up.
the only volume left is at 48.25 or 28.25 and since I am not a breakout trader in front of the fed there is no way for me to get to either of those but will look to fade if/when one hits
I have 1229.25 for gap close we still did not hit. Any other figures?
aggressive longs at 24.25..for that 28 area
went down and bumped off of POC
1228 was VAH
Della , it often does
Gap is getting slowly filled...lookin at 1200 range....wednesday?
Emini Day Trading /
Daily Notes /
Forecast /
Economic Events /
Search /
Terms and Conditions /
Disclaimer /
Books /
Online Books /
Site Map /
Contact /
Privacy Policy /
Links /
About /
Day Trading Forum /
Investment Calculators /
Pivot Point Calculator /
Market Profile Generator /
Fibonacci Calculator /
Mailing List /
Advertise Here /
Articles /
Financial Terms /
Brokers /
Software /
Holidays /
Stock Split Calendar /
Mortgage Calculator /
Donate
Copyright © 2004-2023, MyPivots. All rights reserved.
Copyright © 2004-2023, MyPivots. All rights reserved.
