ES Monday 12-12-11
Just rolled in this Sunday evening from Jerryland where I watched my Cowboys give away the game to the NY Giants ugh! Anyway ...
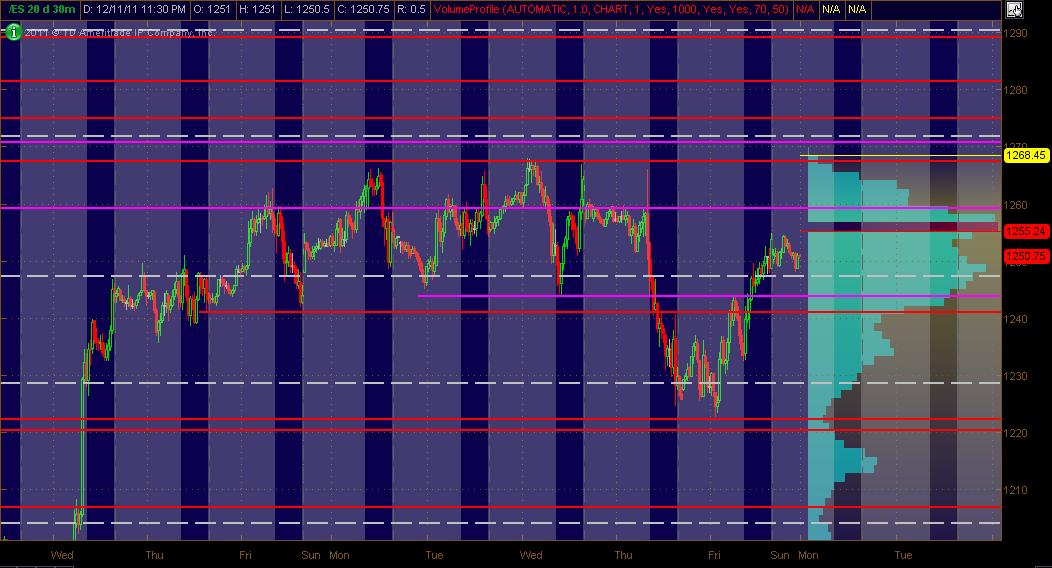
Here's what I've got for my ES MAP of PASR ZONES using a 30min chart of 20 days of data coming into Monday's trading. The Red lines are potential significant levels with Magenta lines as semi-significant. The White dashed lines are the Weekly Pivots. The Light Blue Volume Profile of the past "rolling" 20 days is displayed on the right vertical axis. The Gray background shows non-RTH price activity. Hope, as always, that this is helpful to some as a "MAP"
I know I don't have anything between the 1220-1240 area drawn in ... just couldn't find anything solid enough that I was comfortable to slap a line on. BUT, a couple of places I'll also be watching are the 1230 and 1236 areas. Go Cowboys!
interesting day so far one win and one loss.....a good example of why I try to get out on something in front of completed targets ...like air pockets...
looking for longs now at 26.50 and then will look again under last weeks lows for the 26.50 retest if they push it out that far
single prints trying to form into 29 area above now is targeted area
looking for longs now at 26.50 and then will look again under last weeks lows for the 26.50 retest if they push it out that far
single prints trying to form into 29 area above now is targeted area
keep in mind that any push under the hour low ( if it happens)will create the second set of POTENTIAL single prints on the day and they don't usually blow through volume at 26.50 so easy without coming back up for a retest.. that will be two reasons to not stay short for u short folks and reasons to be agressive on longs
bruce thanks for the multiple updates...whenever you have a chance, the 26.5 high vol u mentioned, i did not have it marked and just doesn't stand out in my daily and weekly profiles...from what day is it if you don't mind?
Originally posted by BruceM
interesting day so far one win and one loss.....a good example of why I try to get out on something in front of completed targets ...like air pockets...
looking for longs now at 26.50 and then will look again under last weeks lows for the 26.50 retest if they push it out that far
single prints trying to form into 29 area above now is targeted area
once again we need to think about taking something in front of air pockets..just in case....especially since we are trending so far
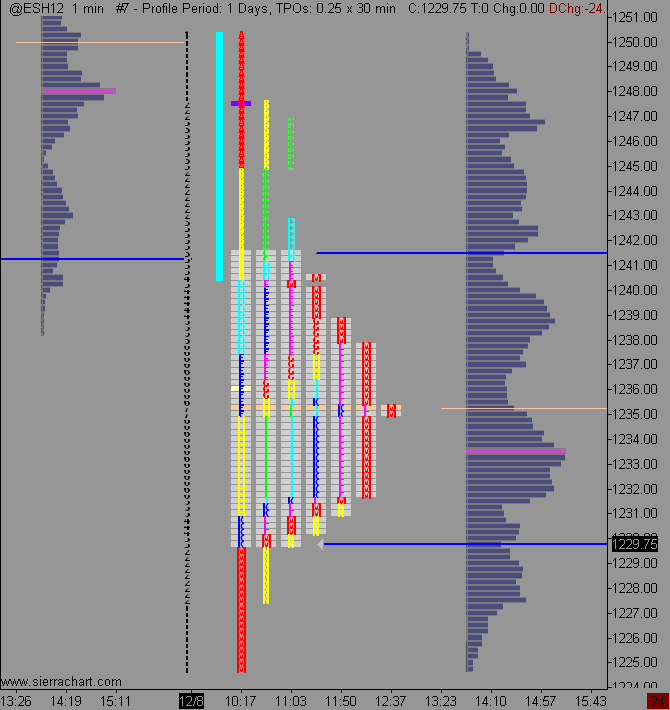
it's peak volume from 12-8 Nick....not based on time just pure volume
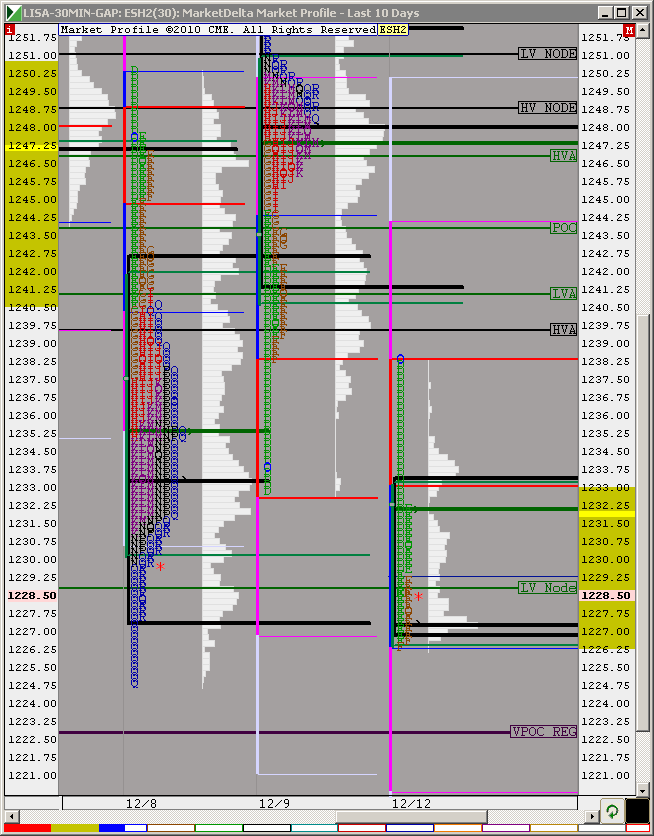
it is not even close on my charts...this is the volume profile i have for 12/8 (data is from dtn-iq btw)


Originally posted by BruceM
it's peak volume from 12-8 Nick....not based on time just pure volume
thanks lisa....your chart looks a lot like mine, meaning you do not have 26.5 as peak volume for 12/8 either
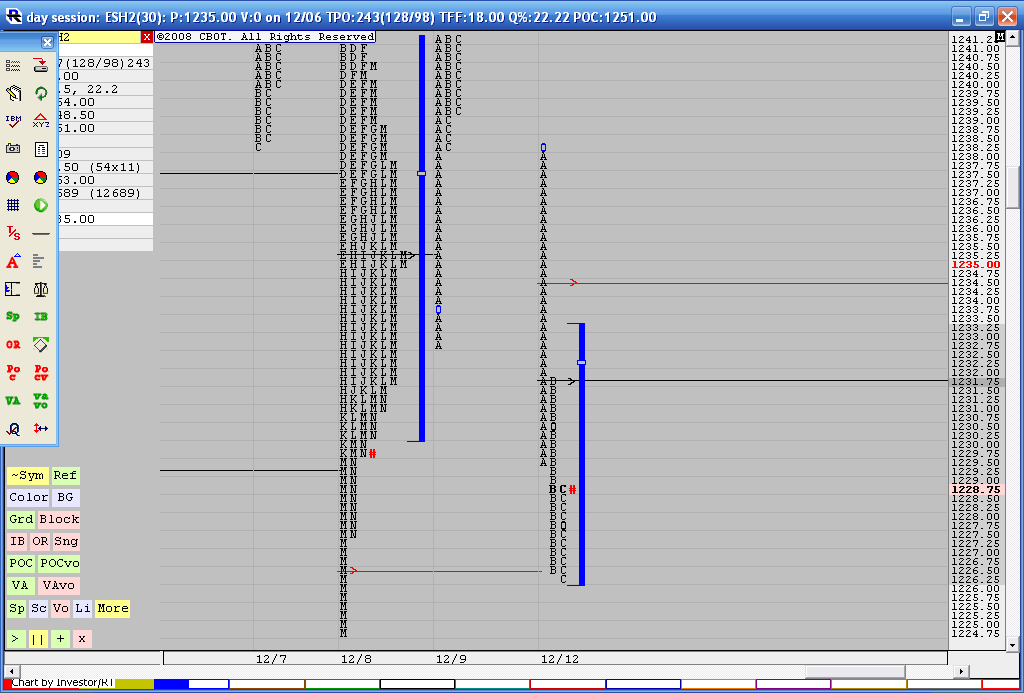
interesting Nick...perhaps someone else can confirm......this is from my IRT charts which is fed with IB data but we also are dealing with a rollover day...maybe that altered things..
red line is snapped by my irt automatically
red line is snapped by my irt automatically
scary...what data feed lisa ?
Here are the instructions:
http://www.mypivots.com/board/topic/10/-1/how-to-upload-charts-and-images-to-the-forum
http://www.mypivots.com/board/topic/10/-1/how-to-upload-charts-and-images-to-the-forum
Originally posted by Futurestr8r
Hello all, how can I post charts to the stream?
Emini Day Trading /
Daily Notes /
Forecast /
Economic Events /
Search /
Terms and Conditions /
Disclaimer /
Books /
Online Books /
Site Map /
Contact /
Privacy Policy /
Links /
About /
Day Trading Forum /
Investment Calculators /
Pivot Point Calculator /
Market Profile Generator /
Fibonacci Calculator /
Mailing List /
Advertise Here /
Articles /
Financial Terms /
Brokers /
Software /
Holidays /
Stock Split Calendar /
Mortgage Calculator /
Donate
Copyright © 2004-2023, MyPivots. All rights reserved.
Copyright © 2004-2023, MyPivots. All rights reserved.


