ES SRs and Fibs 11/16/11
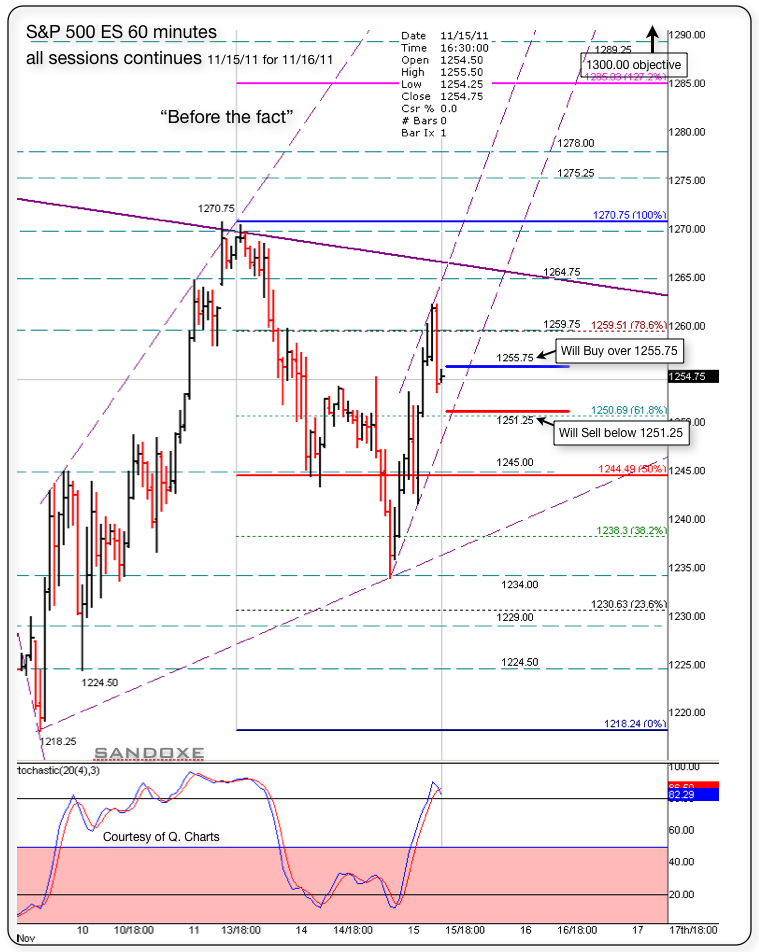
Below is a 60 minutes chart with the S/Rs for night and day traders.
Notice that we have the same set-up as the previous session. Above 1255.75 I will be buying and focusing on uptrend.
if, below 1251.25, I will be selling and focusing on down trend.
The market has the last word and in due time will show us the real deal in dollars and cents.-.
Right now, next hours, next days, next weeks, next months and next years to come, I see for you the same I see for my self: Having the very best of luck, fun, awesome, and incredibly profitable trading experience!!
I anyone here besides me? Should I continue posts?
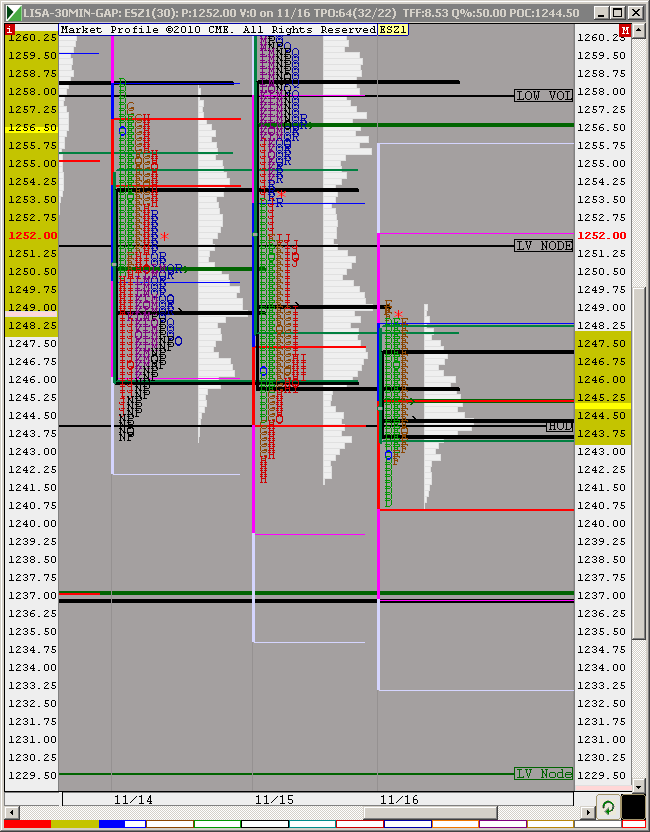
close above 1247.50 ... looking for more up ... testing the grid
i am here
and reading everything you post.
singles filled.
Thankx for the previous charts. And good calls there too :)
Originally posted by Lisa P
singles filled.
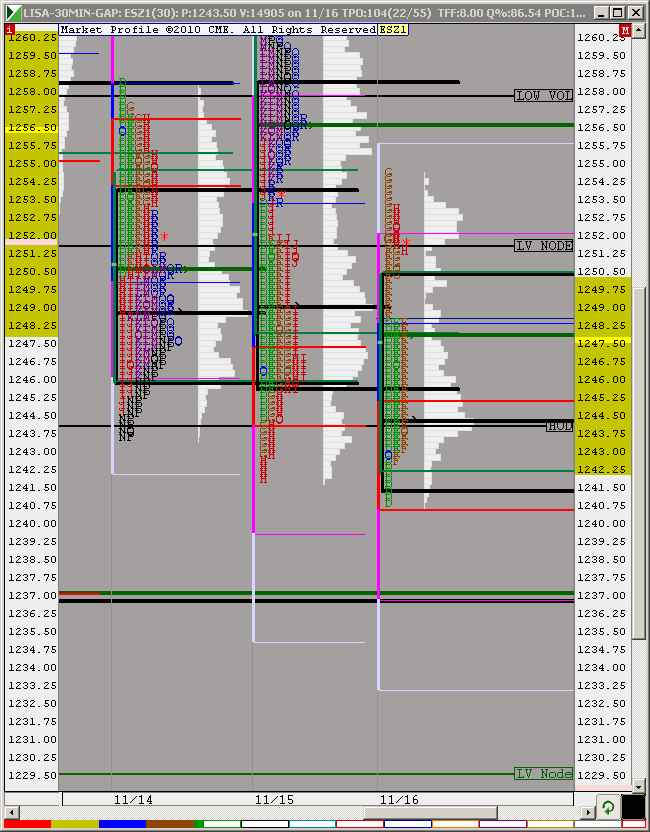
Notice that the price is testing the 50% of this mornings up move. (10 minute chart.) In a bit should be moving back up after few more zigzags. Keep your eye on that 1247.50 (50%) as base for the up move.
In case it goes below 1247.50. Next support is at 1245.75, then 1244.50.
Originally posted by vasuki
yes actually got tweet from Geithner!!!!!!!!!!!!!!!!!!!!!!!!!
=======================================================================
factory said the banks were at serious risk, they missed reporting the downgrade some how ..
Emini Day Trading /
Daily Notes /
Forecast /
Economic Events /
Search /
Terms and Conditions /
Disclaimer /
Books /
Online Books /
Site Map /
Contact /
Privacy Policy /
Links /
About /
Day Trading Forum /
Investment Calculators /
Pivot Point Calculator /
Market Profile Generator /
Fibonacci Calculator /
Mailing List /
Advertise Here /
Articles /
Financial Terms /
Brokers /
Software /
Holidays /
Stock Split Calendar /
Mortgage Calculator /
Donate
Copyright © 2004-2023, MyPivots. All rights reserved.
Copyright © 2004-2023, MyPivots. All rights reserved.


