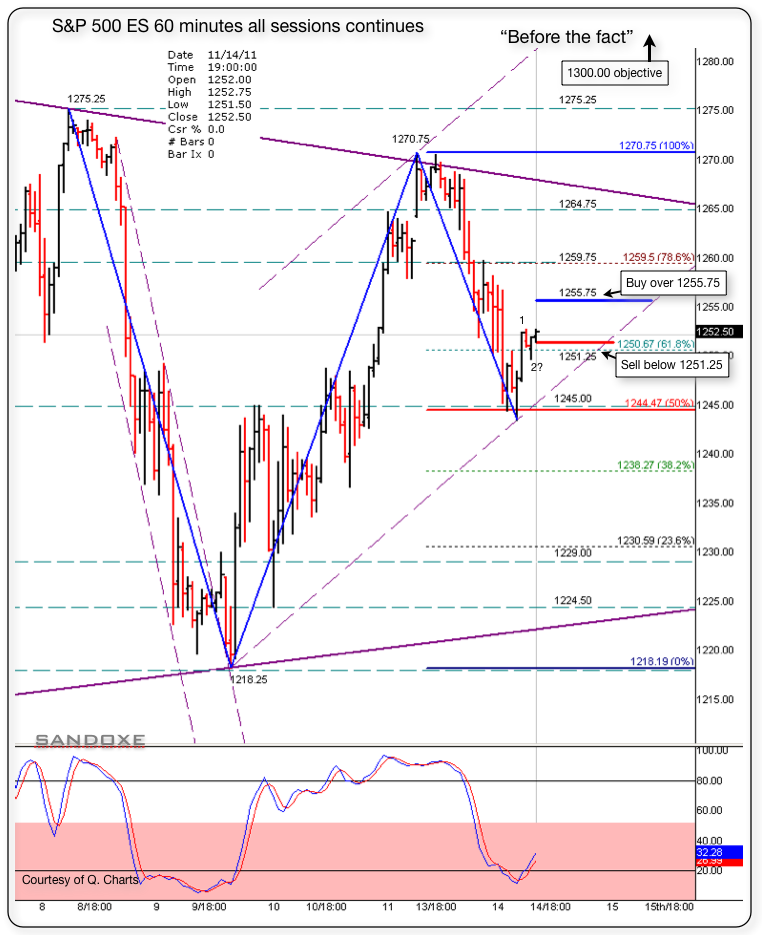
ES SRs and Fibs 11/15/11
Below is a 60 minutes charts with the S/Rs for night and day traders. Notice that the ES tested the 50% at 1244.50 and bounced back up. Above 1255.75 I will be buying and focusing on uptrend.
if, below 1251.25, I will be selling and focusing on down trend, with support at 1245.00 for a reversal.
The market has the last word and in due time will show us the real deal in dollars and cents.-.
Right now, next hours, next days, next weeks, next months and next years to come, I see for you the same I see for my self: Having the very best of luck, fun, awesome, incredibly profitable trading experience!!
12150 the r level to break for DJI
and 1257 the 62% for the drop from 70.75
if 55 holds?? and breaks those(57,58.50) levels=ramp imo
lose 55 and look to 50
if 55 holds?? and breaks those(57,58.50) levels=ramp imo
lose 55 and look to 50
top of sell zone here 1257.25
ist wave from low 30 pts, so third wave can easily go to 1261 and 64 fills the unfilled gap.
It's over 53.0 now. As long as it holds, the next is 70.75. I had it inverse to 19.00. Will see 53.00 is key now.
Originally posted by redsixspeed
Originally posted by redsixspeed
Originally posted by redsixspeed
I am looking for 1253.50 up to 1257.25 to be a sell zone ... close above 1257.25 could be bullish ...
========================================================================
back to the sell zone ... mid point will be key ...
sorry St wave was 20 pts
all that weighed against a potential 36 point decline from hod while under 57 at anytime
1250,1255
that's about all I got here
1250,1255
that's about all I got here
Originally posted by redsixspeed
I am looking for 1253.50 up to 1257.25 to be a sell zone ... close above 1257.25 could be bullish ...
======================================================================
there a 5' close .. we'll see
I see it now. 1266.00 daily trend line resistance possibly end of session.- 3rd wave
Originally posted by vasuki
ist wave from low 30 pts, so third wave can easily go to 1261 and 64 fills the unfilled gap.
Huge resistance at 59.00. (78%, 200%, 127.8%ext) overcoming it, home free to 66.00 test. Zig-zags here 55/59
I ran out of votes to vote you up :(
Originally posted by sandoxe
1242.25. beautiful call. post on 11/16/11 will ya! lol
Originally posted by redsixspeed
Originally posted by redsixspeed
below 1245.25 could mean lower .. holding so far
=====================================================================
I tried to get this up sooner .. had a time finding it .. anyway that 1245.25 is a key area for me .. new #s I have are at 44.00/42.25 but
45.25 is still key ..
Emini Day Trading /
Daily Notes /
Forecast /
Economic Events /
Search /
Terms and Conditions /
Disclaimer /
Books /
Online Books /
Site Map /
Contact /
Privacy Policy /
Links /
About /
Day Trading Forum /
Investment Calculators /
Pivot Point Calculator /
Market Profile Generator /
Fibonacci Calculator /
Mailing List /
Advertise Here /
Articles /
Financial Terms /
Brokers /
Software /
Holidays /
Stock Split Calendar /
Mortgage Calculator /
Donate
Copyright © 2004-2023, MyPivots. All rights reserved.
Copyright © 2004-2023, MyPivots. All rights reserved.
