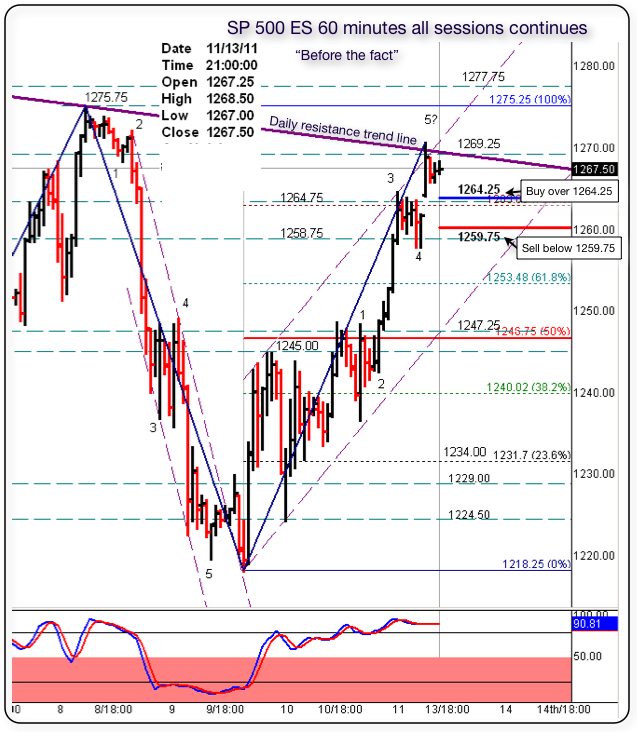
ES SRs and Fibs 11/14/11
Here is the 60 minutes chart set-up with the various S/Rs levels. The E.W. ( Elliot Wave ) count posted Friday afternoon was correct and the 5th wave unfolded in the O/N tonight hitting 1269.00. and testing the daily resistance trend line shown in the chart.
IMO - If the market is really bullish, it should not retrace too much or lower than 1253.00
But as always, the market has the last word and in due time will show us the real deal in dollars and cents.-.
Here is what I said Friday.
___________________________________________________
sandoxe | 11-Nov-2011 at 2:41 PM | Rep: 470 | Posts: 290
Thx Grednfer . Looking at the 10m chart all sessions. If my count is correct, we are currently on a 4 of 3. If so then what you see in the 10m. chart as a possible top is the a,b,c,d,e formation. Market will move up after the e is completed. The objective is at 1269 end of session and a possible 1275 resistance test in O/N.
Will see in due time the market will show us the way.
ES now trading 1262.75 @ 14:40 E.T.
____________________________________________________
Right now, next hours, next days, next weeks, next months and next years to come, I see for you the same I see for my self: Having the very best of luck, fun, awesome, incredibly profitable trading experience!!
Originally posted by redsixspeed
No, these came from another calculation .. but when #s from different method end up in the same area that area is stronger ...
=======================================================================
This quote ^^ was an answer to a question from Monday ... but ES had the same area today {Tuesday} yet calculated from different methods ...
1262.50 I called, was from my calculation and it was also a rat derived from a different method ...
glad u mentioned the rat Red......I'm hoping to post a chart later which should put all of our line drawing methods to rest...and that would include my volume/mp work........naturally I'm kidding about all this ...or am I ???
Hey Bruce, before you put things to rest .. do you see anything at the 1244.00/1242.25 area tonight
Emini Day Trading /
Daily Notes /
Forecast /
Economic Events /
Search /
Terms and Conditions /
Disclaimer /
Books /
Online Books /
Site Map /
Contact /
Privacy Policy /
Links /
About /
Day Trading Forum /
Investment Calculators /
Pivot Point Calculator /
Market Profile Generator /
Fibonacci Calculator /
Mailing List /
Advertise Here /
Articles /
Financial Terms /
Brokers /
Software /
Holidays /
Stock Split Calendar /
Mortgage Calculator /
Donate
Copyright © 2004-2023, MyPivots. All rights reserved.
Copyright © 2004-2023, MyPivots. All rights reserved.
