ES Thursday 11-10-2011
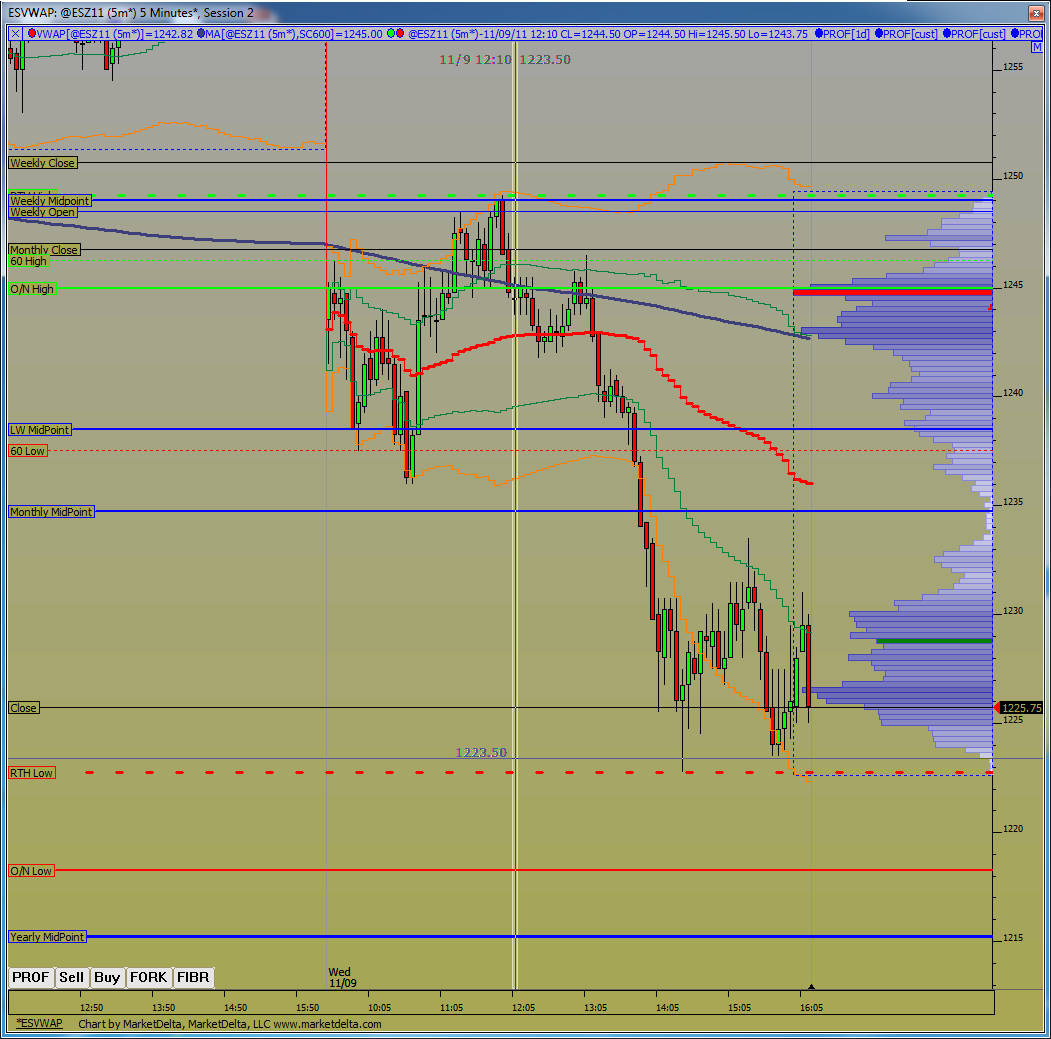
Zone's from yesterday's action.
1233-1236. This is the big one and also represents a single print on an MP chart.
1246-1247. Next most important zone as it marks the reversal down at 1:10 yesterday.
1223-1224. The lows are important as they held the late afternoon challenge.
Looking at the O/N action so far 1245 is the high and is showing a clear double top after the 8:30 news. This makes that 1246-1247 zone important.
Depending on where the market opens will tell you what to do at these zones if you so decide.
Search on this site for posts by Kool Blue on Kools Tools for price and time. KB can explain it way better than me and he uses charts to make it easier to understand.
Originally posted by della
whats the math on these projections ( intresting
Originally posted by prestwickdrive
Originally posted by prestwickdrive
Originally posted by prestwickdrive
Full KT projection of Glbx high 45.0 move to 41.0 gives a full projection of 1234.5
passage of that brings the next cycle of 45.0-39.5 into play giving a full projection of 1230.5
when we took out 1230.5 it brought the next cycle of 1245-1238 into play giving a full projection of 1226.75.
Now it is worth watching how the up projections off 1226 play out. The initial move was to 1229.25 giving an initial projection of 1231.25 and a full of 1234. If the downtrend is intact we should not move up much beyond the initial projection. If we take out 1226 look at your next lower cycle to yield a down target.
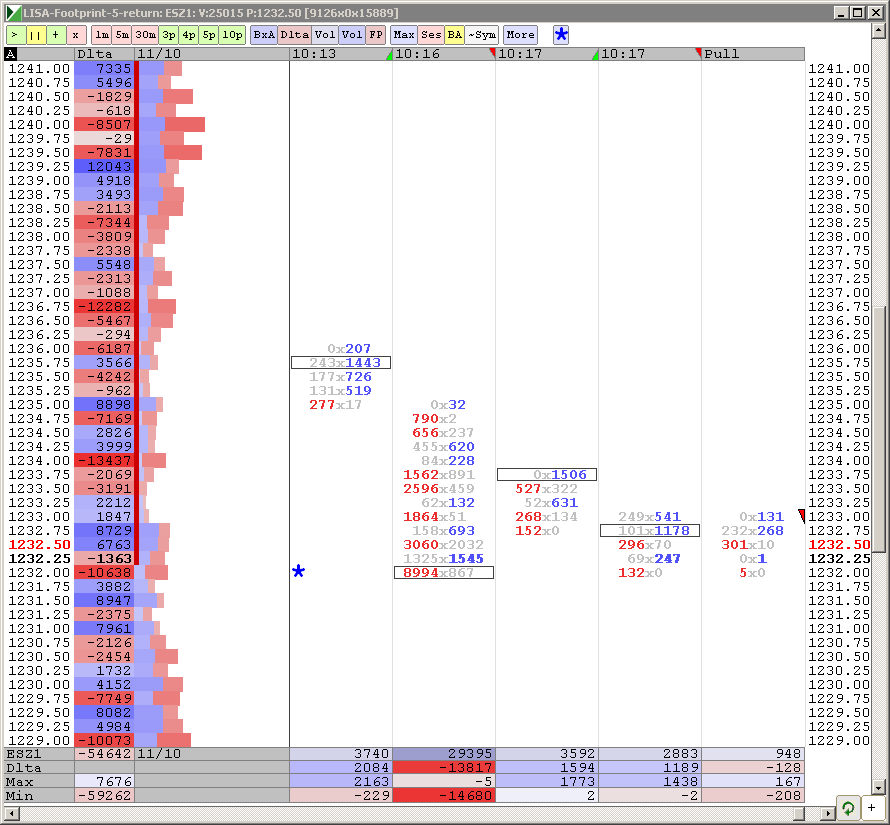
Lisa is this VOL traded or bid and ask
Originally posted by Lisa P
Volume
red - volume at bid, blue - volume a ask. Trick si to figure out if it is "initiating" or "resting" order. Not easy.
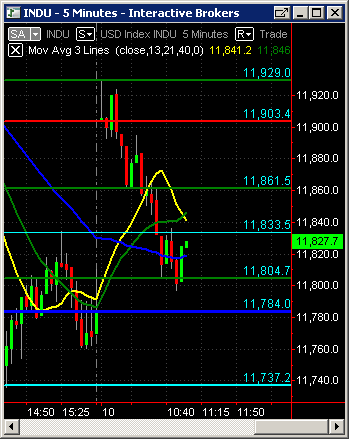
Today, a test of "virgin" Break-outs (BO) and Break-downs (BD) produced good results. I did not take all of it, as I was looking for my "micro" signals and missed one at the bottom by waiting for INDU to close its gap...oh well...
Watch $NQ to lead them down
Grrr, just cannot get in on the moves today
and we never saw 45.00 again
Emini Day Trading /
Daily Notes /
Forecast /
Economic Events /
Search /
Terms and Conditions /
Disclaimer /
Books /
Online Books /
Site Map /
Contact /
Privacy Policy /
Links /
About /
Day Trading Forum /
Investment Calculators /
Pivot Point Calculator /
Market Profile Generator /
Fibonacci Calculator /
Mailing List /
Advertise Here /
Articles /
Financial Terms /
Brokers /
Software /
Holidays /
Stock Split Calendar /
Mortgage Calculator /
Donate
Copyright © 2004-2023, MyPivots. All rights reserved.
Copyright © 2004-2023, MyPivots. All rights reserved.


