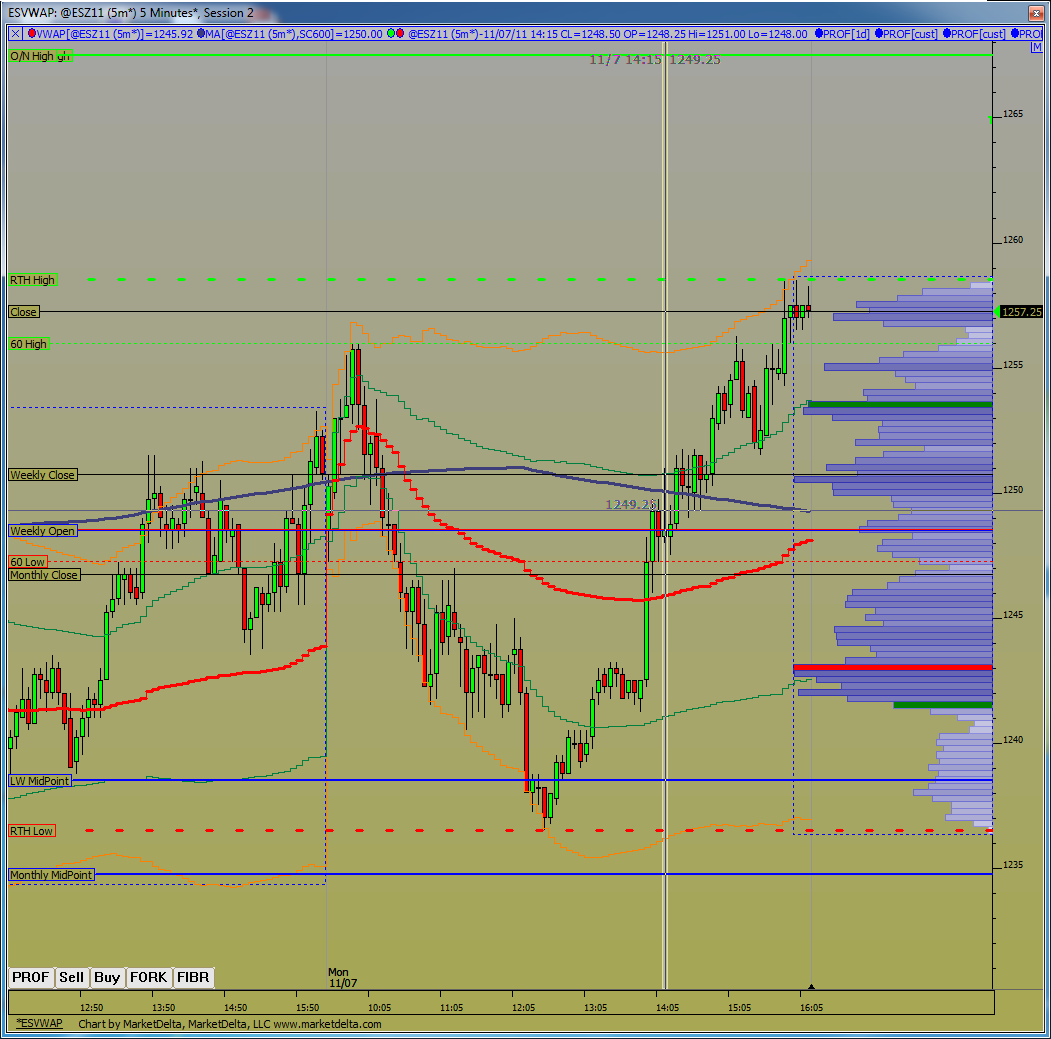
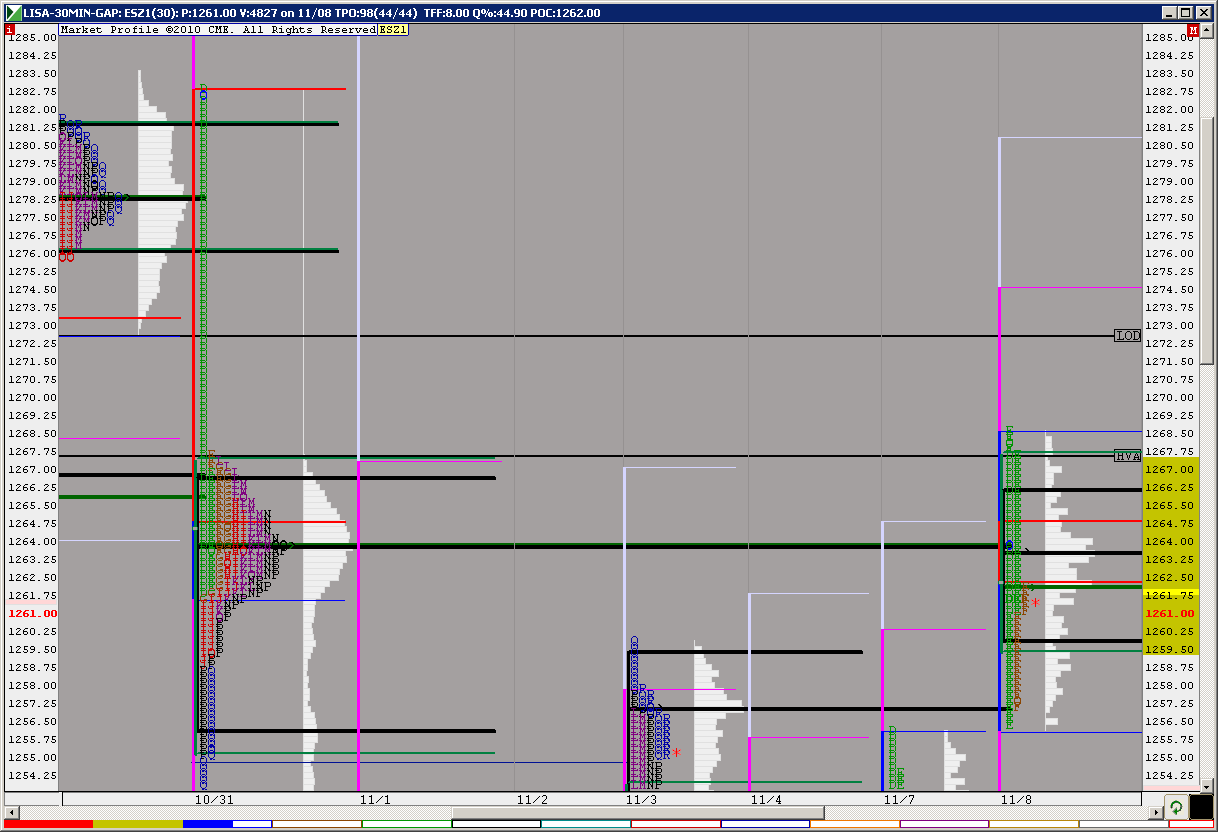
ES Tuesday 11-8-2011
O/N high is currently dead on last weeks RTH high from Oct. 31.
If we open above yesterday's highs then the first support zones are:
1259-1262
1255-1257 – This one is the more important one in my view as it is the breakout area late yesterday.
Lower there is a small zone at 1247.
Lower still is 1240-1241 then down into the RTH low and below with 1230-1235 marking that range for me.
O/N high is first resistance if prices open around this 1265 area they are currently in.
Gm Lorn agree on your numbers 56.25 then 51.75 then that 47.00 we have seen that before 40 75 and 36.50 I have that for the down side
There is a gap between 67 and 72 a pull back this morning could drop kick us to up side to take that out
Gaps should certainly be kept on the radar. Longer-term the market does not like unfilled gaps.
Originally posted by della
There is a gap between 67 and 72 a pull back this morning could drop kick us to up side to take that out
KT initial projection of 1267.5-1263.5 move was 1261.0 which gave a nice bounce. Full projection of 1257.0 (just past gap fill) is valid unless 1267.5 is taken out.
good job prest good call
Keep an eye on the euro...strong so far, equities aren't going to weaken while euro is strong.
Originally posted by della
good job prest good call
TY Della but credit goes to KB. From 1261 the initial move was to 1263.75. That gave an initial projection of 1265.5 which gave a nice SS opportunity. Full projection is 1268.25 unless 1261 is taken out.
From 1265.5 the initial move was to 1262 so do the calculation for downside projections valid unless 65.5 is taken out. They may reinforce the gap fill projection from the GLBX high. I am trading other instruments so I will not be posting more today but I did want to share how KT can help.
Macro veiw. Thinly-traded area above. 30-min trend is still up. ES last gap close at 1282 on my charts.
I know i wish they would get it over with
Emini Day Trading /
Daily Notes /
Forecast /
Economic Events /
Search /
Terms and Conditions /
Disclaimer /
Books /
Online Books /
Site Map /
Contact /
Privacy Policy /
Links /
About /
Day Trading Forum /
Investment Calculators /
Pivot Point Calculator /
Market Profile Generator /
Fibonacci Calculator /
Mailing List /
Advertise Here /
Articles /
Financial Terms /
Brokers /
Software /
Holidays /
Stock Split Calendar /
Mortgage Calculator /
Donate
Copyright © 2004-2023, MyPivots. All rights reserved.
Copyright © 2004-2023, MyPivots. All rights reserved.

