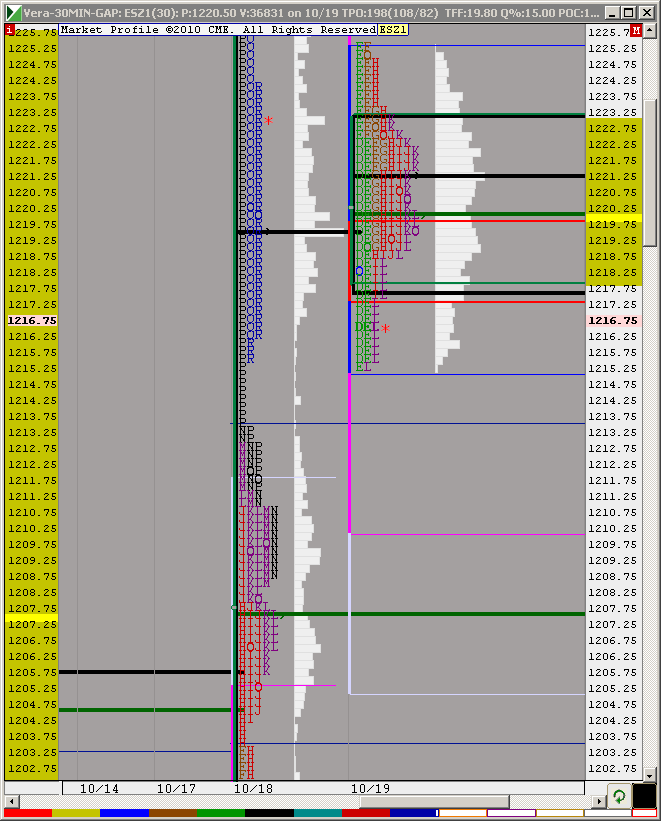
ES WED 10/19/2011
BruceM | 18-Oct-2011 at 4:06 PM | Rep: 47.8k | Posts: 10.6k | mail
I'm burned out from forum life...LOL....but I'll leave you with this today.....we had the 23.75 area marked as a long term Auction high from yesterdays thread. We also had the last low volume area from yesterday thread marked at 1217.
That news event spike blew through the 1217 without a retest at first . Some may have been thinking that my volume idea was going to fail and the 1217 was going to be passed on by. I was thinking that myself. Once we started to get back under the 23.75 long term bracket then you owed it to yourself to start thinking about the 1217 again...
main numbers as I type going into tomorrows trade will be
93.75 - 95
1202 - 1204
1207 - 1208
and 1213.75 - 1215.25 but I'm not sure that this won't be filled in before we close...we'll see
good luck
Nice work DavidS!!
As you point out 1229 is a stake here! So it will be the base or S/R to play from. (There are some numbers at 1234 and 1244 for ES, and we are congruent about the spike.)It will be worse if spikes up and then down below 1229.00 with failure to recover above 1229...ouch! SELL!! SELL! Using 1229/1230 as S/R!!
See The NQ100 daily Has the same Fib. configuration as the #INDU.(DJ index) The 1.618% is just above the 2435.50 high made on 7/26/11. The Fib. is just above that high at 2429.40. Same looks as the DJ! So we have to be at the look out for that equivalent S/R in the ES. That will be 1229/30
And yes it's between today, tonight and tomorrow 30 hrs window.
DaviS: Thanks for sharing the way you see.-.
lisa watch foot prints please at 13 or 14 arae
Thx Della. I too, from time to time look at the ADX. More so when I can't make heads or tails of what the frikiry frack is happening??? Are we coming or going??? LOL
Originally posted by della
when i see days like this on nas es I look at a indercator called ADX on the 5 min when it is in the over sold area tells me sooner or later to up side or down side there will be a brake then adx will move up its like a coil
adx moving up now trend down
see if 17.99 holds i down
looks like it wants to fill in the single prints from yesterday 1213.25-1215.5
The expiration will be interesting as well as EOM.
I'll also note the DEC contract 50% level is 1215.25.
Paul,ever vigilant, noted the Cash yearly 50% level at 1224 and a good tell to watch here.
Either exceeds this wall or doesn't. Looking over my shoulder.
I'll also note the DEC contract 50% level is 1215.25.
Paul,ever vigilant, noted the Cash yearly 50% level at 1224 and a good tell to watch here.
Either exceeds this wall or doesn't. Looking over my shoulder.
LV area in that range from yesterday
And dibs to MonkeyMeat for noting the 1215 level also in his great post with charts Sunday or Monday.
Della, I have singles to 1213.50, see chart below. With regard to Footprints, it is hard to post in real time, as it takes me relatively long time to post on this Forum. YOu can watch 1 min or volume chart for faster responce.
I exclusively use a 1-tick tick chart and try to capture 1 tick always using market orders for both entry and exit ... no stops - ever.
Emini Day Trading /
Daily Notes /
Forecast /
Economic Events /
Search /
Terms and Conditions /
Disclaimer /
Books /
Online Books /
Site Map /
Contact /
Privacy Policy /
Links /
About /
Day Trading Forum /
Investment Calculators /
Pivot Point Calculator /
Market Profile Generator /
Fibonacci Calculator /
Mailing List /
Advertise Here /
Articles /
Financial Terms /
Brokers /
Software /
Holidays /
Stock Split Calendar /
Mortgage Calculator /
Donate
Copyright © 2004-2023, MyPivots. All rights reserved.
Copyright © 2004-2023, MyPivots. All rights reserved.
