ES Thursday 10-6-11
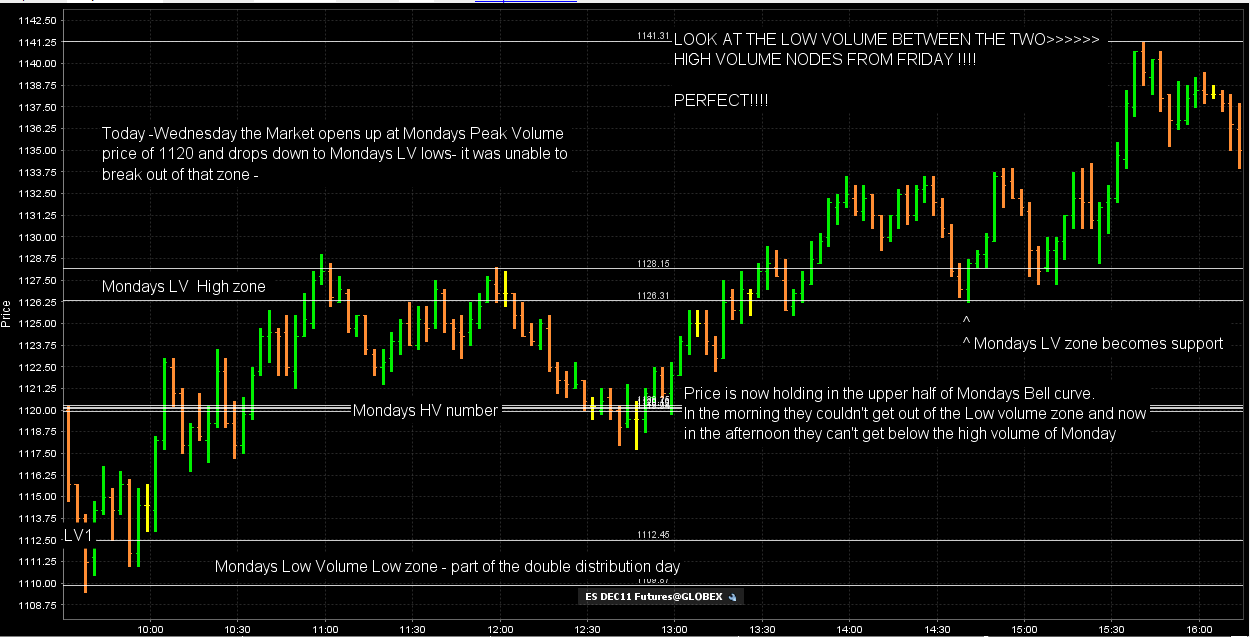
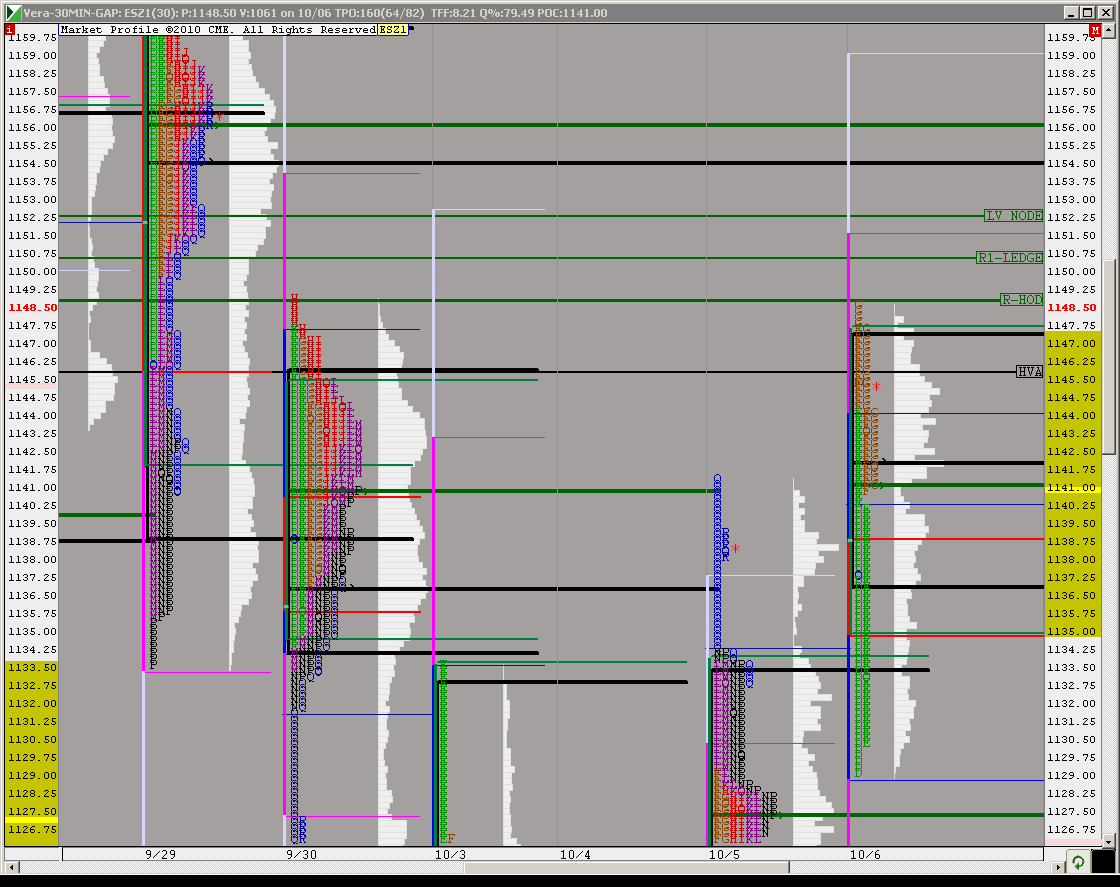
Here is a recap chart from Wednesday. I'm going to get the date right tonight. Very instructive day and was hoping we'd have some good examples this week. You may want to reference Mondays and Fridays chart to understand this a bit more as those "bell curves" interacted nicely with todays trade.
ideally the short traders will not only want to keep it below the low volume from last friday but also that high volume node from that day....
This is more of a conceptual idea and not trade specific...if we get above the 90 minute highs then that could start to change things... especially if the 43.75 - 45 turns into support...
either way it is best to wait for levels generated from previous completed days...I think it is hardeer to trade from the unfolding days levels
above the current highs we have peak volume from last thursday at 54.25 ( I don't trade there) and then 60 - 63...all from last thursdays trade...see my thread if you have any visual questions or need clarity...or ask them here..
back to papertrading now (90 mins up )
a common pattern: They hold the peak volume from a day and then go to the next key area...in theory that would be 1154 area.....this is theory...so theory and actual trades are so different...
just tossing that out there for something to watch..this happened yesterday...we consolidated in th eupper half of a day and went higher...
just tossing that out there for something to watch..this happened yesterday...we consolidated in th eupper half of a day and went higher...
ES now testing 1148.00 again. and above it. If finding support here the 1164.00 is my next objective.
Below 1148.00 I have the 1143.00 as S/R.-
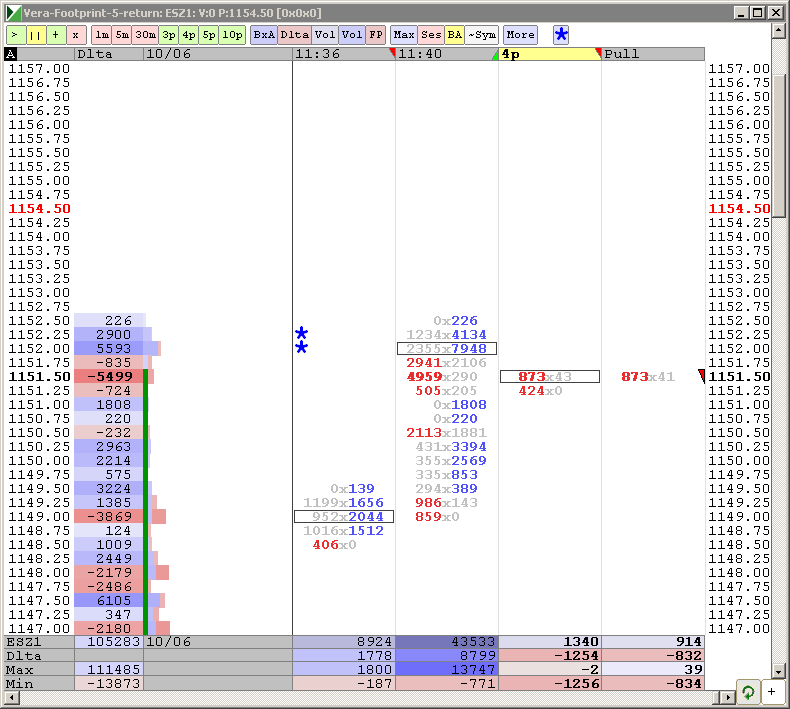
ES trading now 1149.25 @ 11:37
If we make it that high, I show a single print at 1163.50 from 9/29 for those looking for confluence. I also show a naked POC at 1157.00 also from the 29th. My targets are 1156.25 and 1162.75 for the upside if we get that high.
Originally posted by sandoxe
ES now testing 1148.00 again. and above it. If finding support here the 1164.00 is my next objective.
Below 1148.00 I have the 1143.00 as S/R.-
ES trading now 1149.25 @ 11:37
I have old gap with close at 1156.50. ANyone else has different number?
pardon the ignorance but could someone point me in the rite direction to Bruce's thread? Thank you
Originally posted by NickP
thanks !
My pleasure NickP.
Emini Day Trading /
Daily Notes /
Forecast /
Economic Events /
Search /
Terms and Conditions /
Disclaimer /
Books /
Online Books /
Site Map /
Contact /
Privacy Policy /
Links /
About /
Day Trading Forum /
Investment Calculators /
Pivot Point Calculator /
Market Profile Generator /
Fibonacci Calculator /
Mailing List /
Advertise Here /
Articles /
Financial Terms /
Brokers /
Software /
Holidays /
Stock Split Calendar /
Mortgage Calculator /
Donate
Copyright © 2004-2023, MyPivots. All rights reserved.
Copyright © 2004-2023, MyPivots. All rights reserved.


