ES Thursday 9-29-11
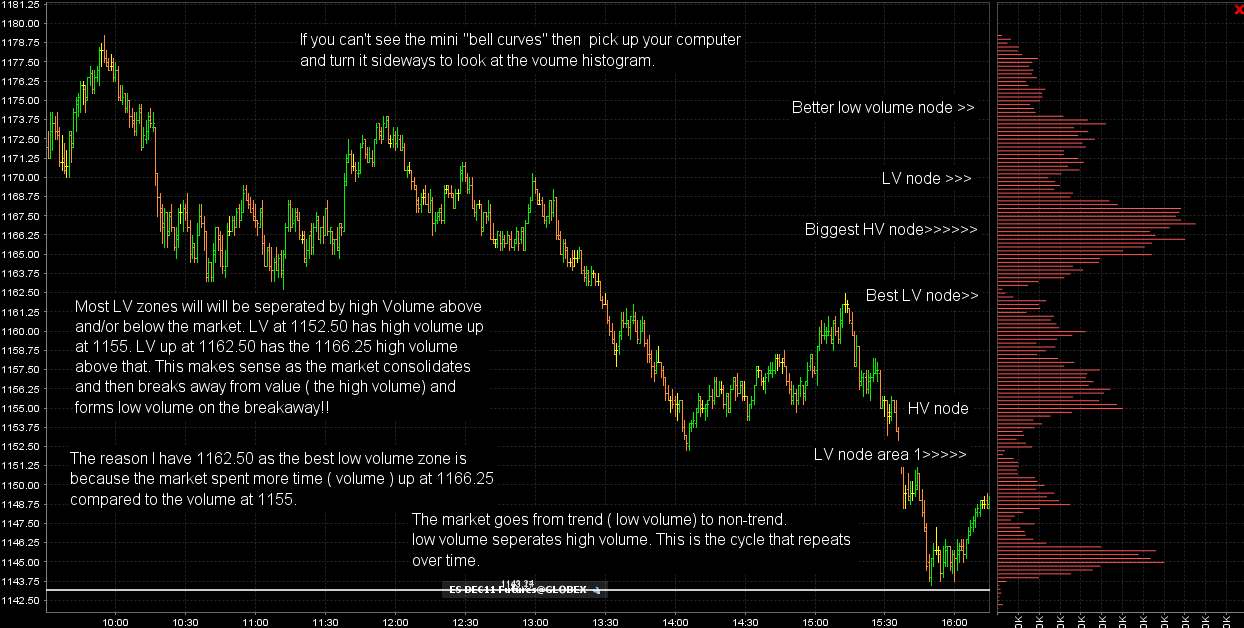
I thought that we could use a refresher and some basics in case we have some new folks here. Most will know this stuff but hopefuly this will inspire some questions or help clear up any questions regarding the use of high and low volume in your analysis. Here is todays chart with the key areas labelled for Thursdays trade.
thanks for the chart sandoxe...
why was the 48 number crtical to u if i may ask?
also, regarding the fib projection u r showing down at 31.5, what levels were u using to get that ?
why was the 48 number crtical to u if i may ask?
also, regarding the fib projection u r showing down at 31.5, what levels were u using to get that ?
Originally posted by sandoxe
Originally posted by sandoxe
Yes BM I will post a chart latter saying why.
Stop out B.E. 1147.75 @ 13:57 Will try again latter.
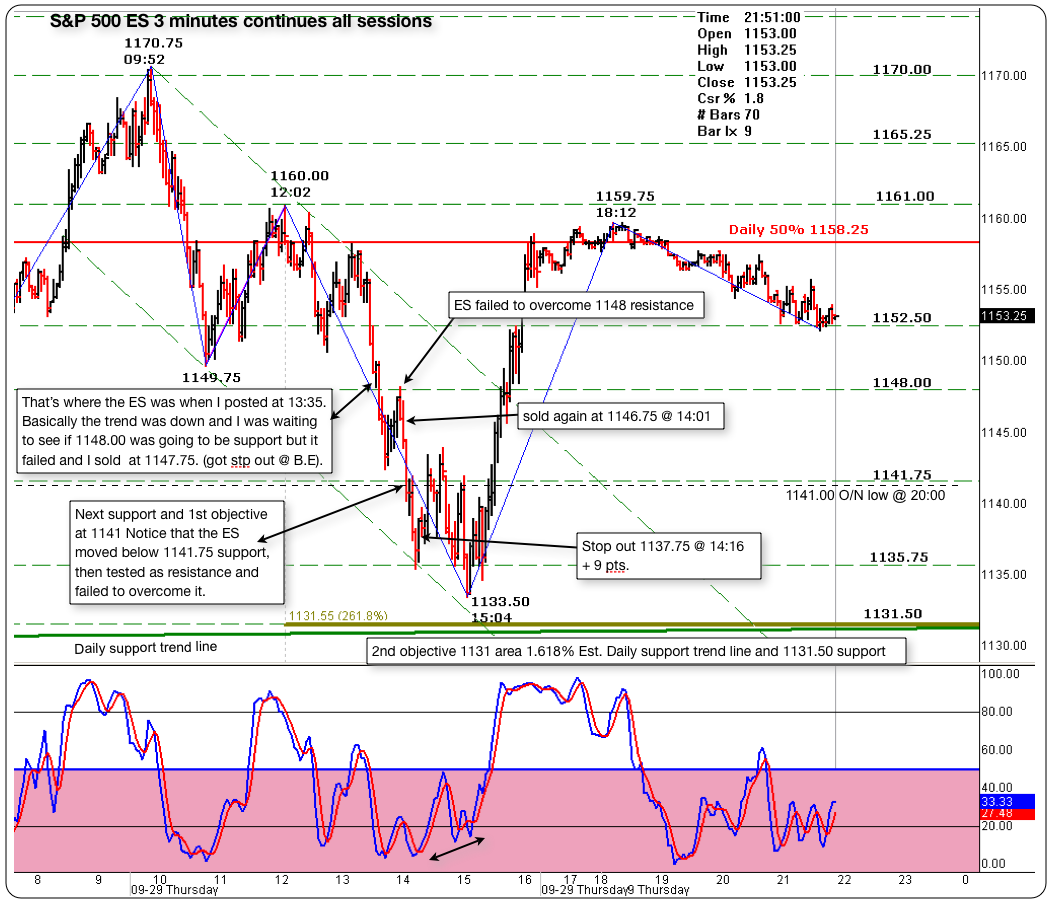
Here's a 3 minute chart with all the details and reasons for the posted trade.
Basically the trade started "anywhere within the trend" the trend was down and I like easy money. That was a momo play from S/R at 1148.00. Granted, it took me two shots to get it right, but, that's what happens some times and if you believe in what you see, heck give it a shot! Keep that stop near by.
I hope this helps in some way.
apk781 - YW. The levels for the fibonacci extensions are 1160.00 high and 1149.75 low.
The 1148.00 level is a S/R derived mathematically. Most of the time the price respond or test the S/R levels as seeing in the chart.
One reason why I like to posts the charts and the S/R levels, is bc people can check with their own stuff in their charts. If there's congruency between my numbers and their stuff, then it's most likely that, the S/R level is or will be of some importance in the future
thanks for the chart sandoxe...
why was the 48 number crtical to u if i may ask?
also, regarding the fib projection u r showing down at 31.5, what levels were u using to get that ?
The 1148.00 level is a S/R derived mathematically. Most of the time the price respond or test the S/R levels as seeing in the chart.
One reason why I like to posts the charts and the S/R levels, is bc people can check with their own stuff in their charts. If there's congruency between my numbers and their stuff, then it's most likely that, the S/R level is or will be of some importance in the future
Originally posted by apk781
thanks for the chart sandoxe...
why was the 48 number crtical to u if i may ask?
also, regarding the fib projection u r showing down at 31.5, what levels were u using to get that ?
Originally posted by sandoxe
Originally posted by sandoxe
Yes BM I will post a chart latter saying why.
Stop out B.E. 1147.75 @ 13:57 Will try again latter.
Here's a 3 minute chart with all the details and reasons for the posted trade.
Basically the trade started "anywhere within the trend" the trend was down and I like easy money. That was a momo play from S/R at 1148.00. Granted, it took me two shots to get it right, but, that's what happens some times and if you believe in what you see, heck give it a shot! Keep that stop near by.
I hope this helps in some way.
Bruce et al,
Just revisited this thread after reviewing several MP webinars. Some pretty big "names" are trading from HVN to fill LVN as opposes to vice versa. Can you comment on what convinced you to go LVN to HVN?
It does seem HVN to LVN can be done with tighter stops it appears and also may have significantly larger targets. I am unsure but it appears that way.
Love all the posts, education and comments everyone provides.
Good luck to all.
good question Mike.. the big webinar that seems to be going around is the Robin Mesch one and she in general is a long term trader.
High volume represents acceptance so many have traded there and those who try to catch trends will attempt many breakout trades in order to usually not only get to the next low volume zone but the next big high volume zone.
I think it will come down to what makes you feel comfortable. I like the LVN's because price seems to move away from there faster and go back to previous value. When they fail the smarter or better traders can reverse and try to ride the break away from value.
Price also tends to hang around HVN's a bit too long for me. I like immediate feedback as I am patient to wait for trades to SET UP, I am not that patient when I am in them.
So trading at LVN's expecting price to go at least try some sort of retest to high value makes sense. You can substitute the words "break away points" for LVN's as that makes sense to most...breakouts don't work too often in the ES...at least not without a retest...so we trade at those poiints
a lot of this is time frame dependant. that is just my view. I've seen webinars and all of them are showing great examples AFTER the trades are over...almost to imply that it is easy.
If it was so easy they wouldn't need to sell webinars and courses and advisory services but it doesn't mean that we need to discount all their ideas. Take what works for you. Most get frustrated when they don't catch trends. Faders need to be happy taking small pieces out of the market a high percent of the time and leave the trends to others. So we need to define what kind of trader we REALLY want to be.
Forgot to add, isn't HV to LV how the LVA get filled in over time?
Eventually the Bell Curve gets completed,typically by filling in LVA right?
Thanks in advance.
Eventually the Bell Curve gets completed,typically by filling in LVA right?
Thanks in advance.
yes Mike..again it's time frame dependant but how do we hold onto trades when they can take hours or days trying to FILL in low volume points on a larger time frame ? I can't but perhaps others can.
I like to put trades on outside of value expecting price to return..
Think of it like the big car sales we sometimes see or any other bargain..If you can buy a car way below value then you would probably do it and that bargain won't stay around long for all to participate in...the same is true for the market....untill price is accepted at new levels...it really is an auction!
Originally posted by Big Mike
Forgot to add, isn't HV to LV how the LVA get filled in over time?
Eventually the Bell Curve gets completed,typically by filling in LVA right?
Thanks in advance.
Thanks Bruce, I knew I wasn't the only one doing some homework this morning-LOL
Mike
Mike
Stock market traders can now get stock market tips from market experts.
so many market experts, so little time ...
Trading strategy and setups are briefly given on the platform visit and get more useful information about any type of trading
Emini Day Trading /
Daily Notes /
Forecast /
Economic Events /
Search /
Terms and Conditions /
Disclaimer /
Books /
Online Books /
Site Map /
Contact /
Privacy Policy /
Links /
About /
Day Trading Forum /
Investment Calculators /
Pivot Point Calculator /
Market Profile Generator /
Fibonacci Calculator /
Mailing List /
Advertise Here /
Articles /
Financial Terms /
Brokers /
Software /
Holidays /
Stock Split Calendar /
Mortgage Calculator /
Donate
Copyright © 2004-2023, MyPivots. All rights reserved.
Copyright © 2004-2023, MyPivots. All rights reserved.

