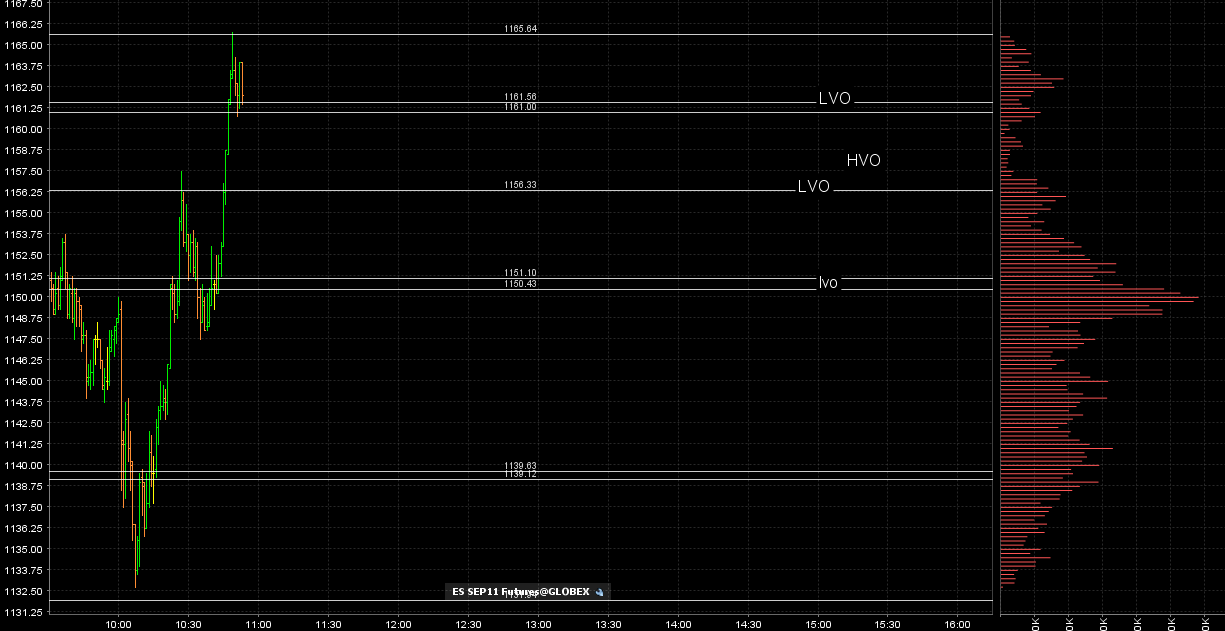
ES Fri 8-26-11
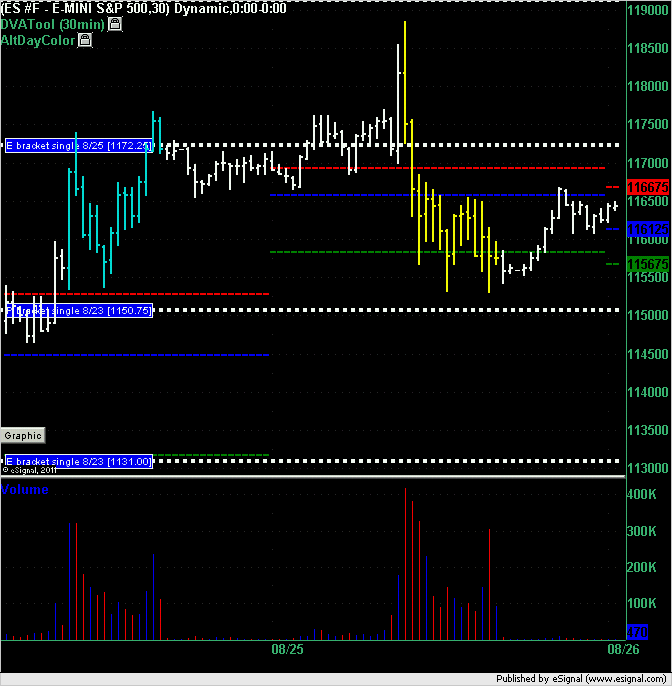
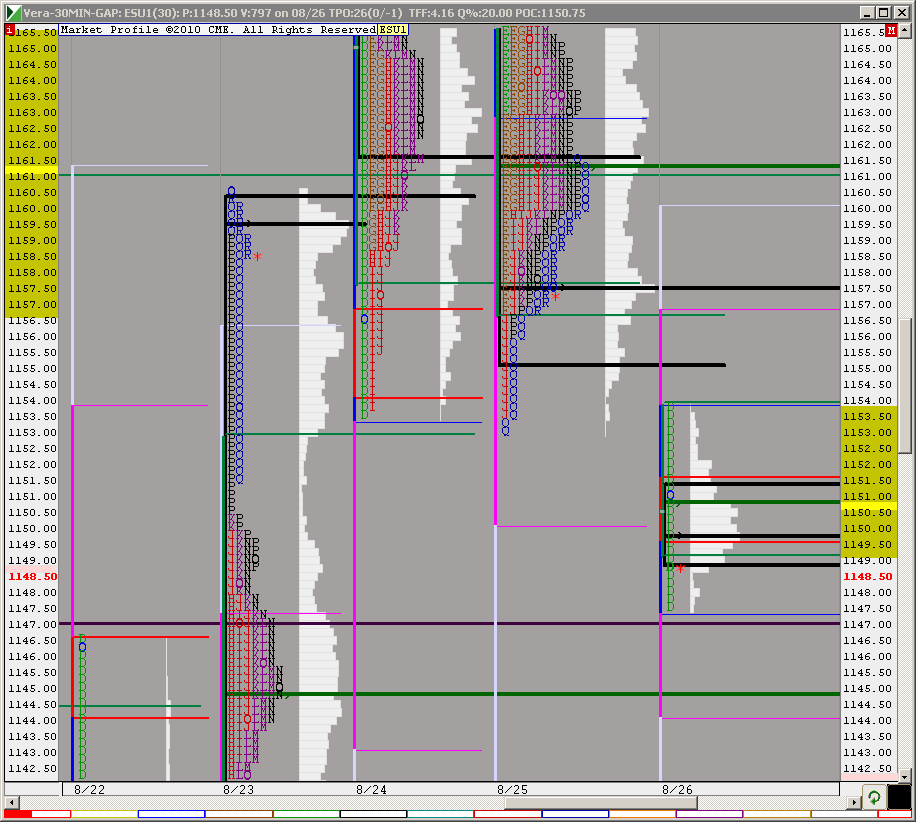
Interesting market from Thursday's trading. Thursday's breakaway in the E bracket left a single print at 1172.25 (short signal if we touch it) and from Tuesday we have the single print at 1150.75 (long signal if we touch it). So the ES is boxed between those 2 prices and the VAH and VAL are also boxed inside those prices. Don't treat these as signals in isolation. Combine them with other high probability setups. For more of those see what BruceM has written in these pages.
low volume from the Overnight session lines up nicely with the VA numbers as posted on the form....I'm adding 51.25 and then down at 39.50...
so 56 and 61 are obvious areas of interest for me also
so 56 and 61 are obvious areas of interest for me also
Looks like they are going to backfill that thinly traded hole at left until Mr. B's speech
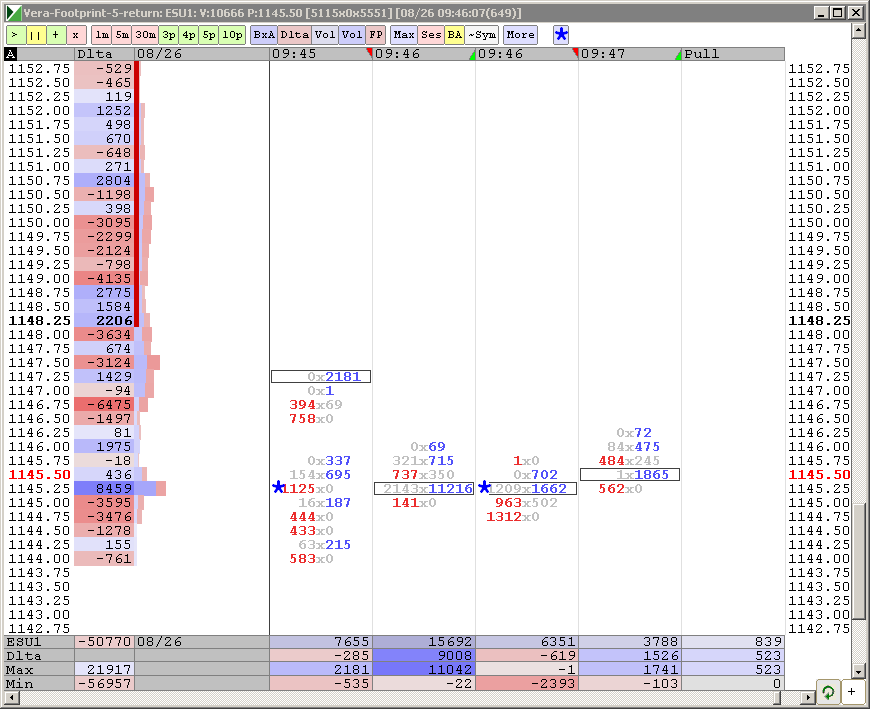
these buys under the 39.75 would need to get out at air fill of 43.75......
sorry that was too late to get off and post....see how that key number came back for air fill is the real point
sorry that was too late to get off and post....see how that key number came back for air fill is the real point
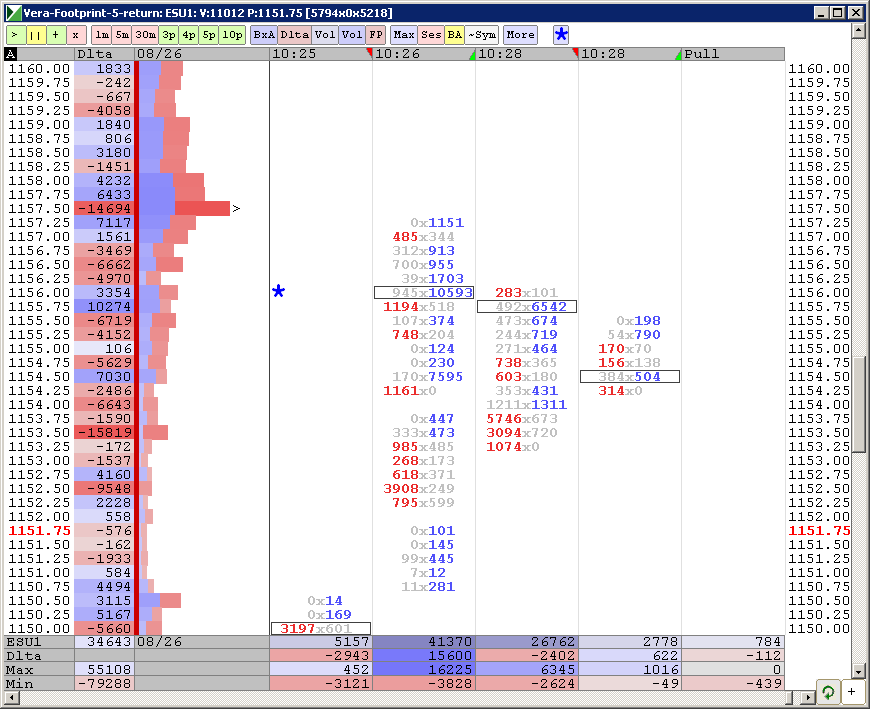
next area to watch is 30 - 32...!!!
Why does this remind me of pin the tail on the donkey and you dont even have to be blindfolded.
for two days we spent lots of time consolidating in the 56 - 69 area....expecting price to just breeze on through on the way back up is not the high probability trade.....for me the fades will come a bit higher ...especially if they can push out the hour highs into the 61 - 63 area!!
I agree Rburns but here is how my lines looked.....the only line I didn't mention was that Tursday afternoon high up near 65....but hopefully some can see how all these lines get tested.....57 - 58 is a critical area for bulls to hold and a target for me...air pocket..
it is also the peak volume from the Overnight !!
you can barley make out my line at 31.75 at the lows.....it didn't hit into that zone..
it is also the peak volume from the Overnight !!
you can barley make out my line at 31.75 at the lows.....it didn't hit into that zone..
unfortunately this new entry method for me is too quick so I am hoping some see how these low volume zones react over time.....
It takes bigger traders than you and I to create low volume on the histogram and MOST times these bigger traders can only push it so far without an opposing reaction...then the market retraces to see if the big traders are interested in defending their buys or sells....so it comes back to the area...same concept as air pockets but these low volume points are created in the overnight and previous sessions!!
Today was especially good because we lined up so well with the traditional value area numbers!!
yes...u will see low volume at single prints but using the volume histogram will give you better levels in my opinion. You quite often will have low volume WITHOUT single prints. Single prints is based on time which was part of market profile and used as a substitute for volume long ago. These days we have great access to real time volume so lets use it to our advantage.
and don't forget about the low volume area from the Overnight sessions. That is what the NQ bumped up against at todays NQ highs !
and don't forget about the low volume area from the Overnight sessions. That is what the NQ bumped up against at todays NQ highs !
Emini Day Trading /
Daily Notes /
Forecast /
Economic Events /
Search /
Terms and Conditions /
Disclaimer /
Books /
Online Books /
Site Map /
Contact /
Privacy Policy /
Links /
About /
Day Trading Forum /
Investment Calculators /
Pivot Point Calculator /
Market Profile Generator /
Fibonacci Calculator /
Mailing List /
Advertise Here /
Articles /
Financial Terms /
Brokers /
Software /
Holidays /
Stock Split Calendar /
Mortgage Calculator /
Donate
Copyright © 2004-2023, MyPivots. All rights reserved.
Copyright © 2004-2023, MyPivots. All rights reserved.
