ES Wed 8-24-11
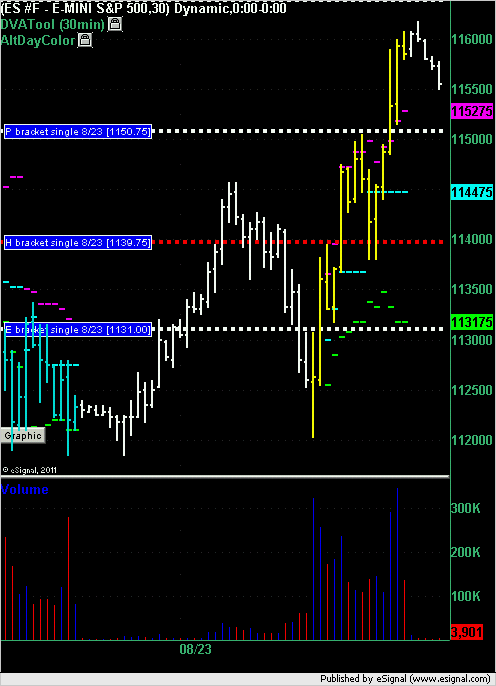
The yellow bars on the chart below are from RTH trading on Tuesday. The white bars on either side are the overnight session bars.
As with most trend days and wide spread days single prints get left behind. The following single prints were generated on Tuesday:
E bracket at 1131.00
H bracket at 1139.75 (filled)
P bracket at 1150.75
After forming the single print in the H bracket the market returned to this price and filled it in triggering a long trade at 1139.75. The draw down was 1.75 points to the subsequent low of 1138.00 and then the best run-up during RTH was 21 points to end of day high of 1160.75.
Did anybody reading this take that single print long?
i am, don't take me wrong...i trade a bit differently (in fact a lot) but i find mp intriguing to say the least, so trying to pick it up little by little (remember i asked you abt good books to read and so on? i am still in that phase), but not trading based on that at all
was just going back through the price action and that question popped up, that's all
whenever you have a moment, could you post your renko chart so that i can see why the 64 area was a no go and the 72ish was
thanks again and congrats on your trade
was just going back through the price action and that question popped up, that's all
whenever you have a moment, could you post your renko chart so that i can see why the 64 area was a no go and the 72ish was
thanks again and congrats on your trade
Originally posted by BruceM
No Nick...I had no signal as per my renko and delta charts until we started getting above the 71 number...it should be noted that I'm hoping most find their own numbers as I type fast and sometimes I transpose my numbers incorrectly....I work off lines I have already marked on my charts....that line up their started at 72.50 and not 71 !!!
so hopefully most are doing their homework!!
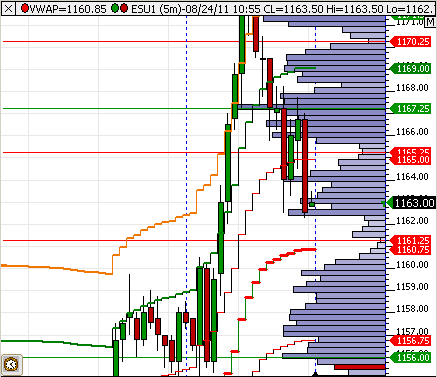
Low Volume node is near - 1161.25
my VWAP now is at 1160.75
Emini Day Trading /
Daily Notes /
Forecast /
Economic Events /
Search /
Terms and Conditions /
Disclaimer /
Books /
Online Books /
Site Map /
Contact /
Privacy Policy /
Links /
About /
Day Trading Forum /
Investment Calculators /
Pivot Point Calculator /
Market Profile Generator /
Fibonacci Calculator /
Mailing List /
Advertise Here /
Articles /
Financial Terms /
Brokers /
Software /
Holidays /
Stock Split Calendar /
Mortgage Calculator /
Donate
Copyright © 2004-2023, MyPivots. All rights reserved.
Copyright © 2004-2023, MyPivots. All rights reserved.

