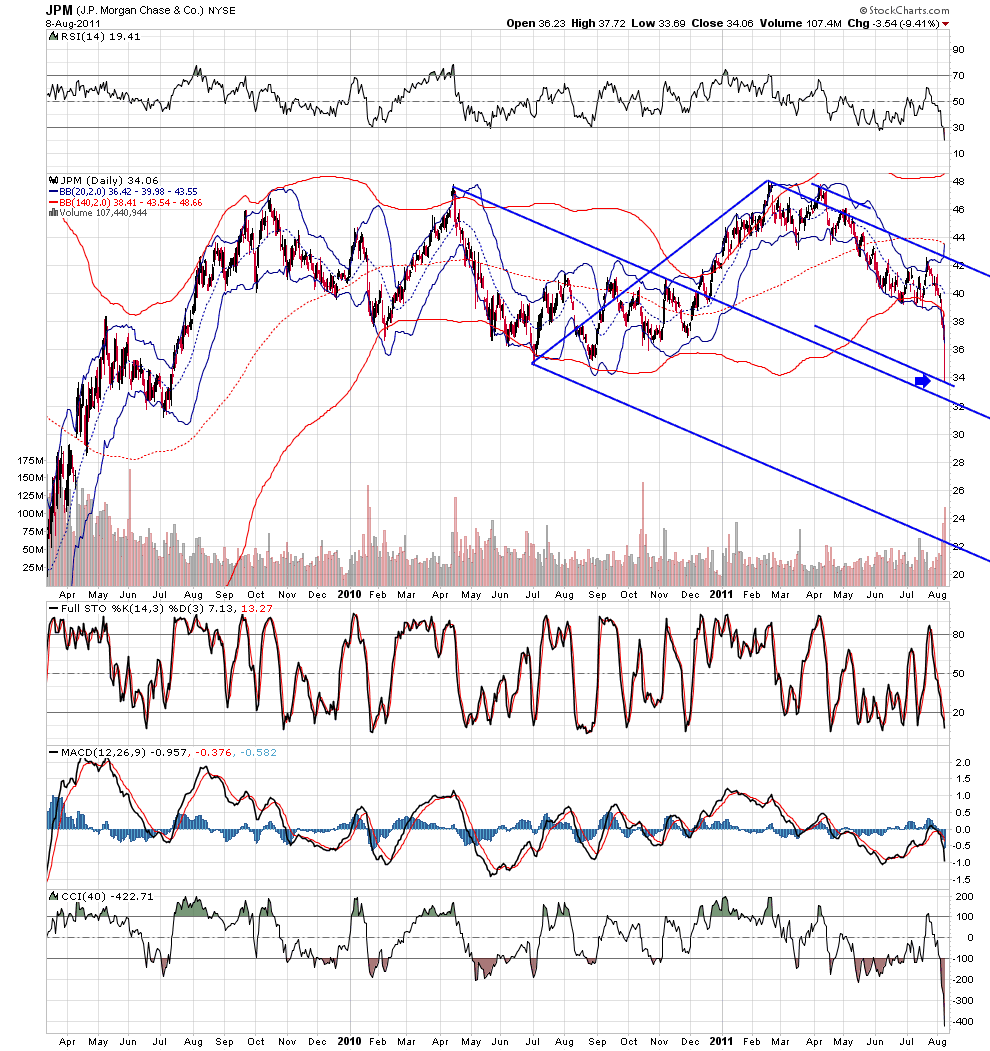
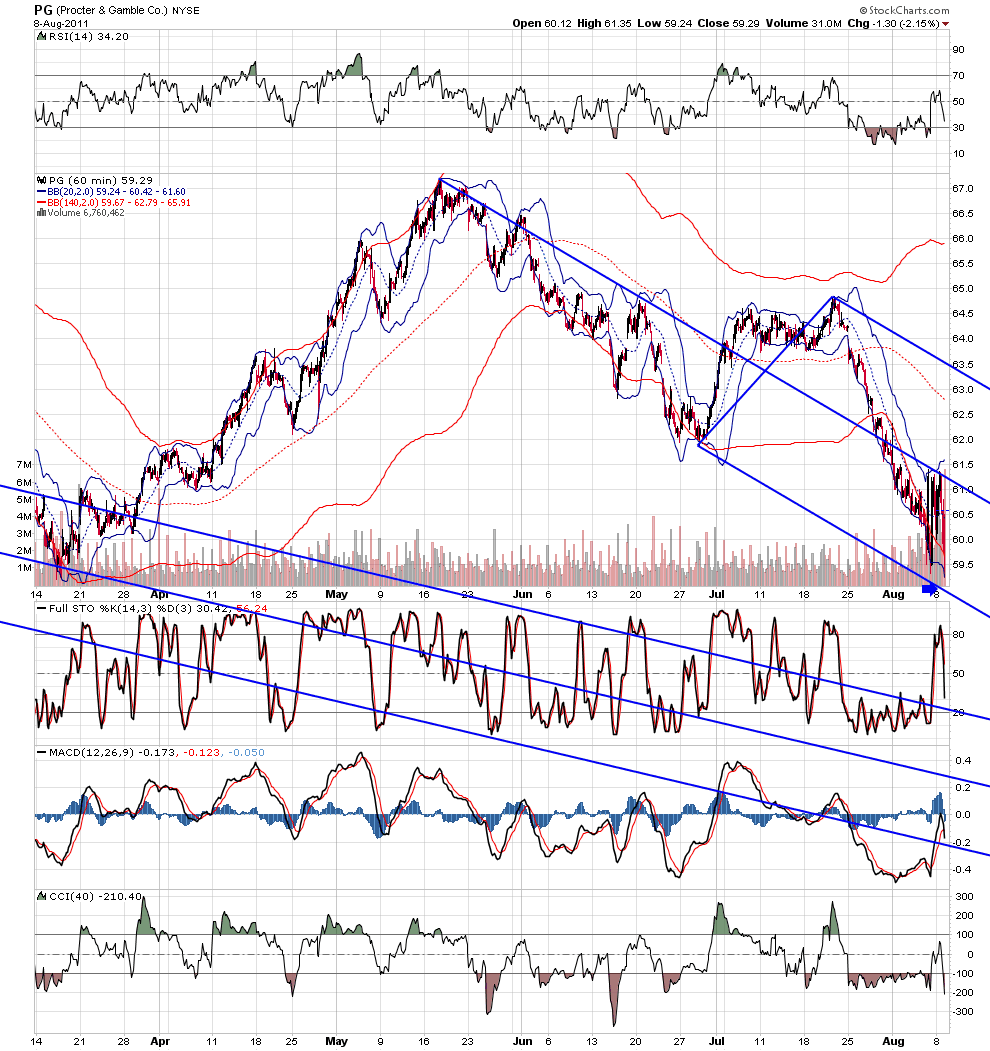
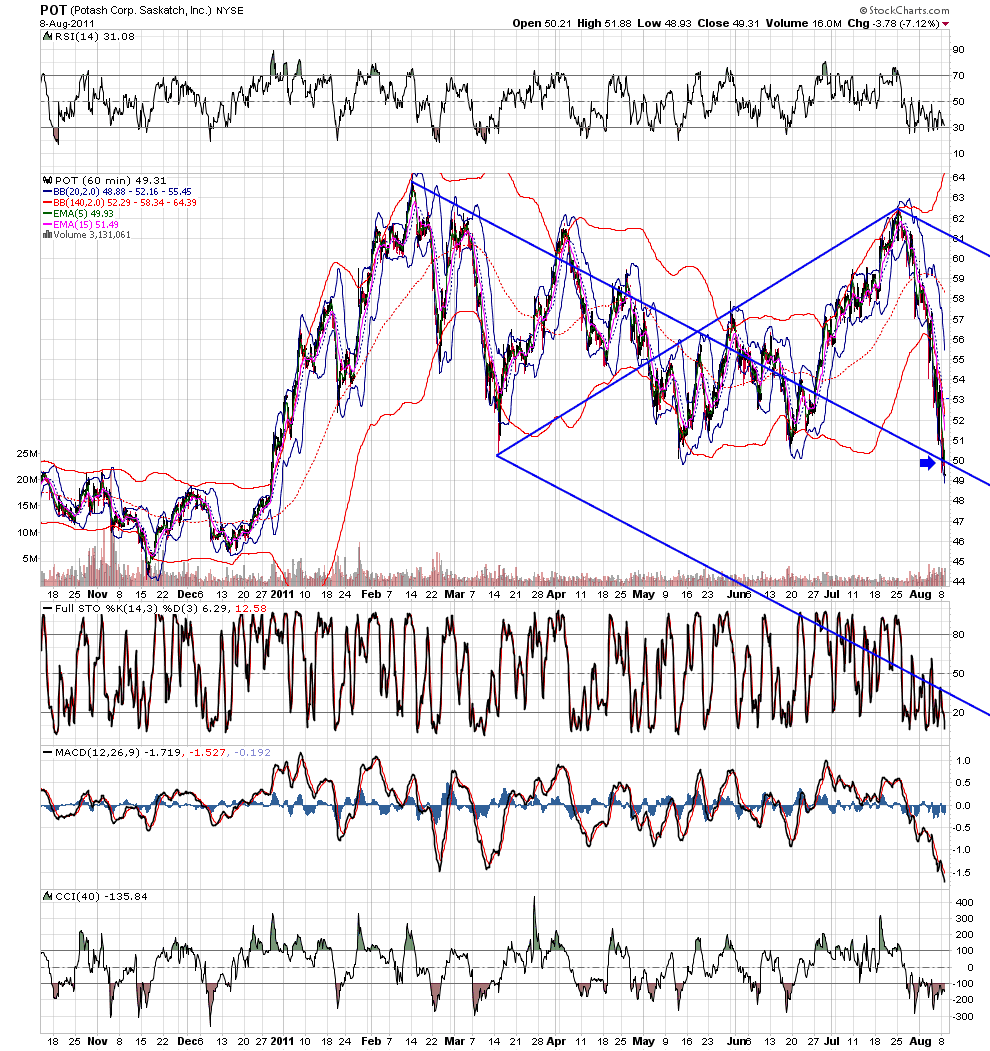
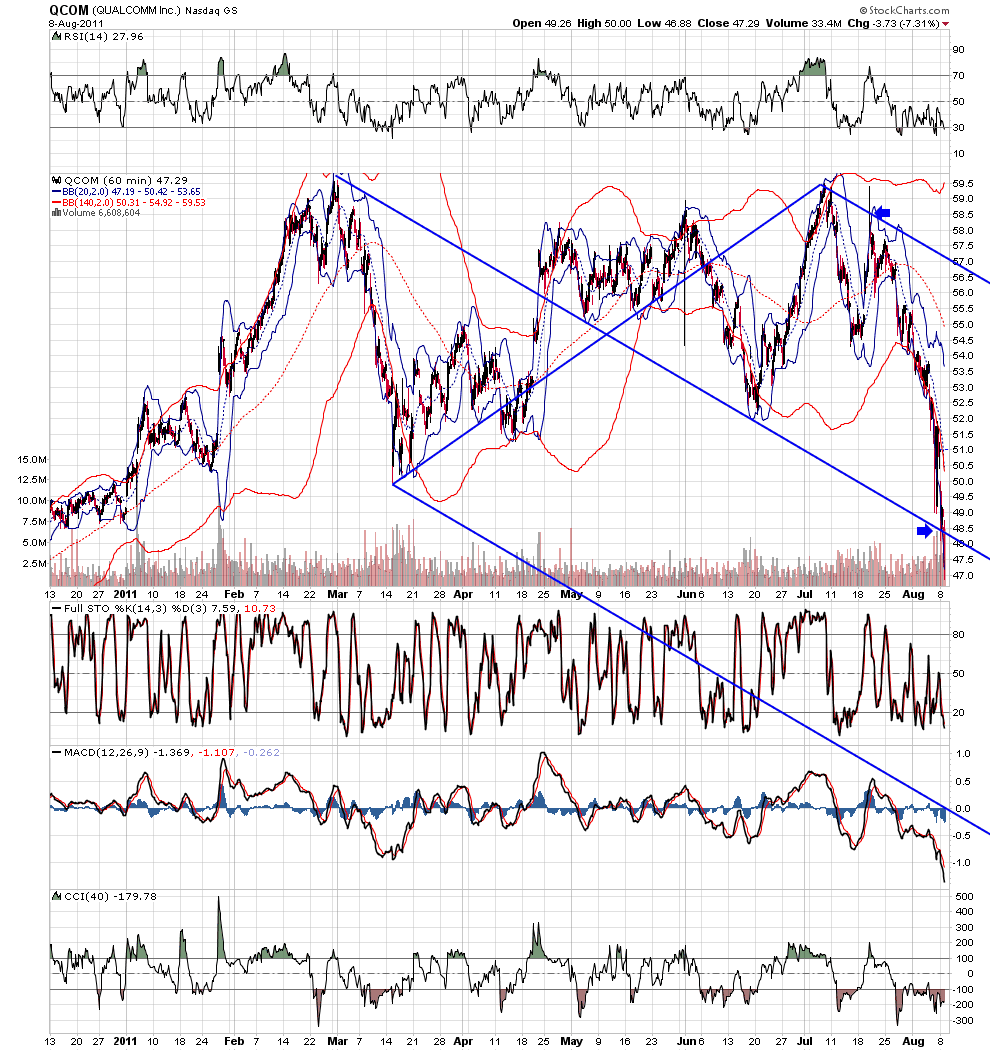
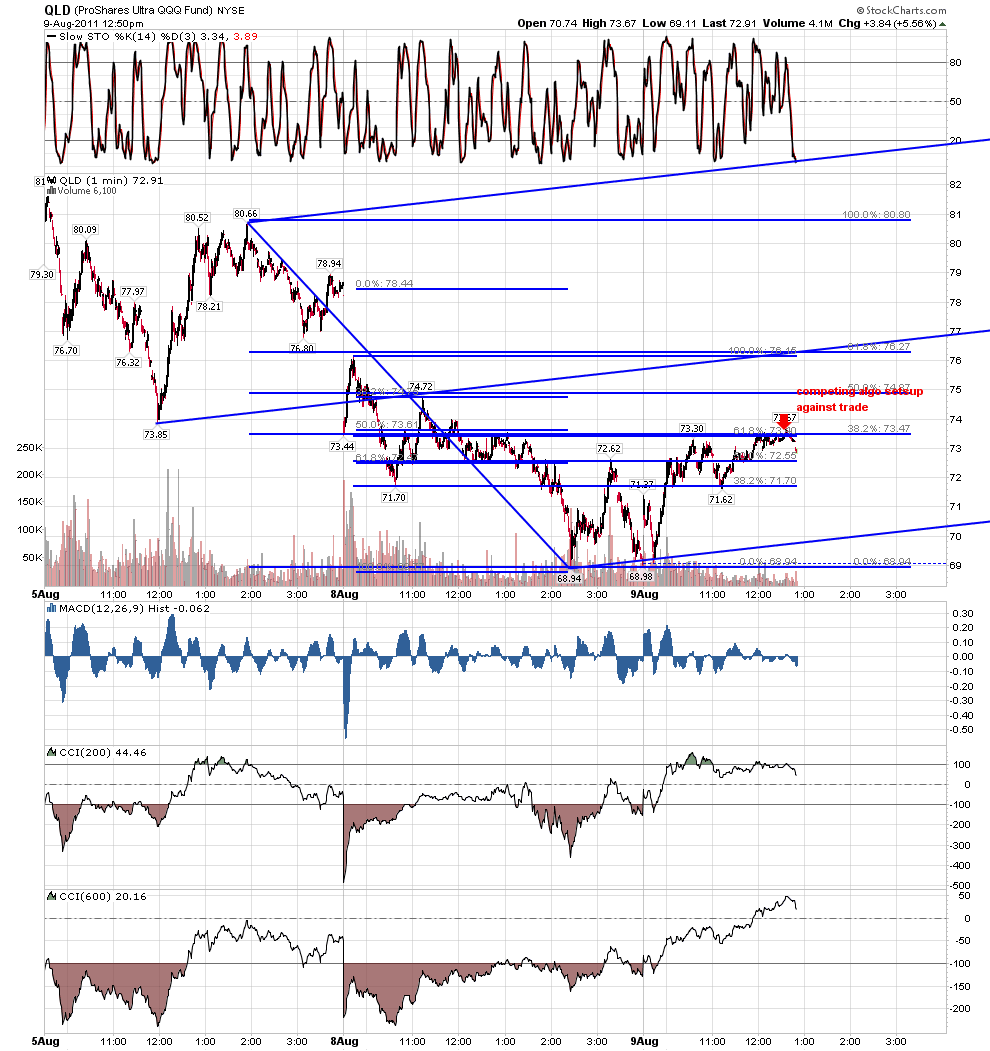
chart dump
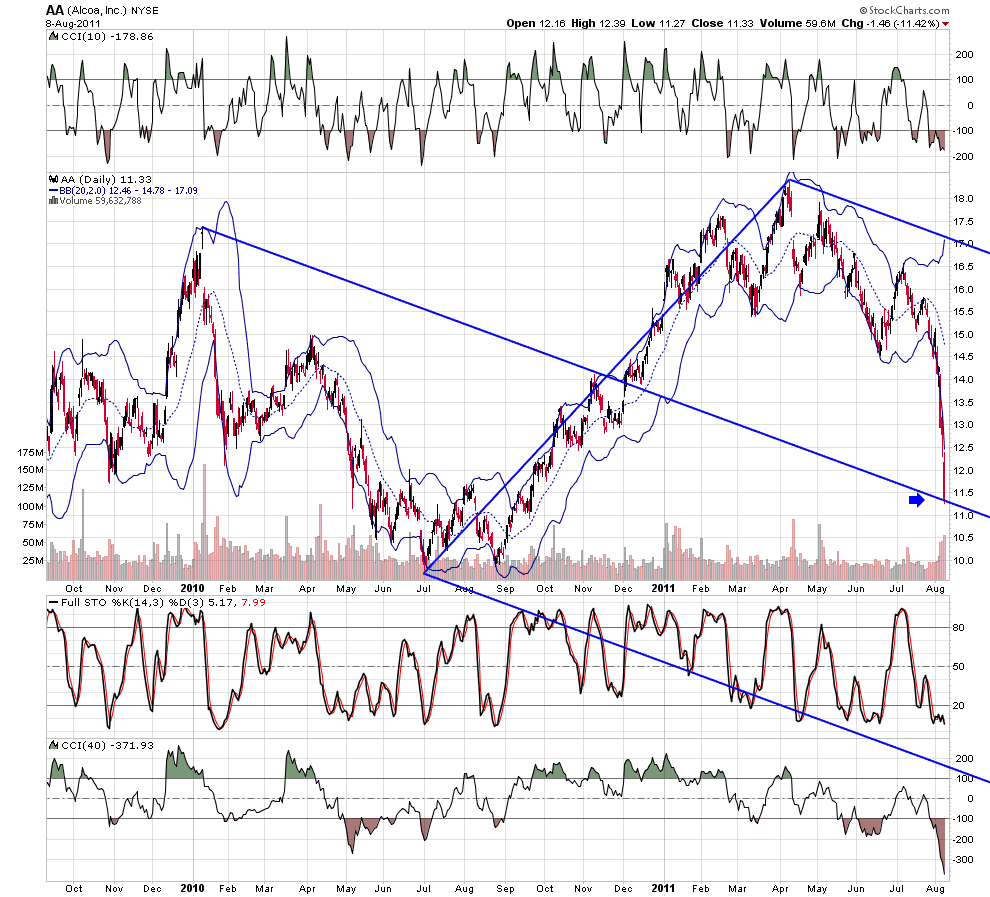
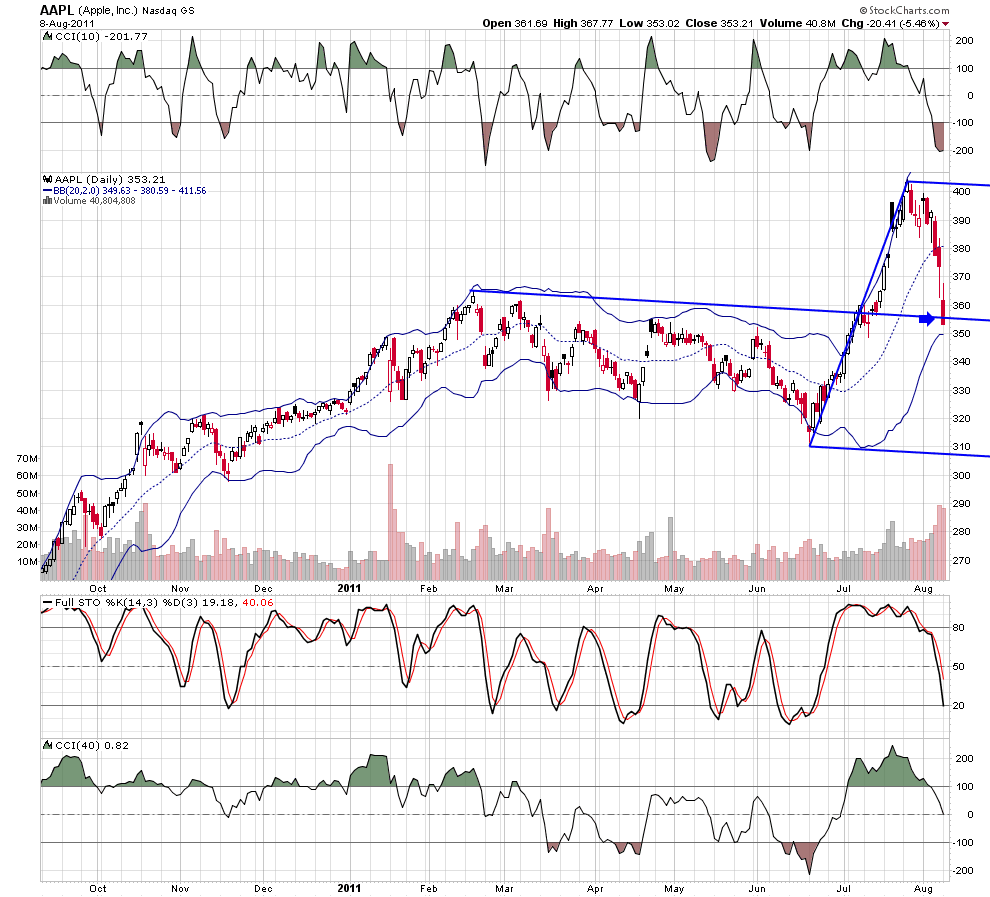
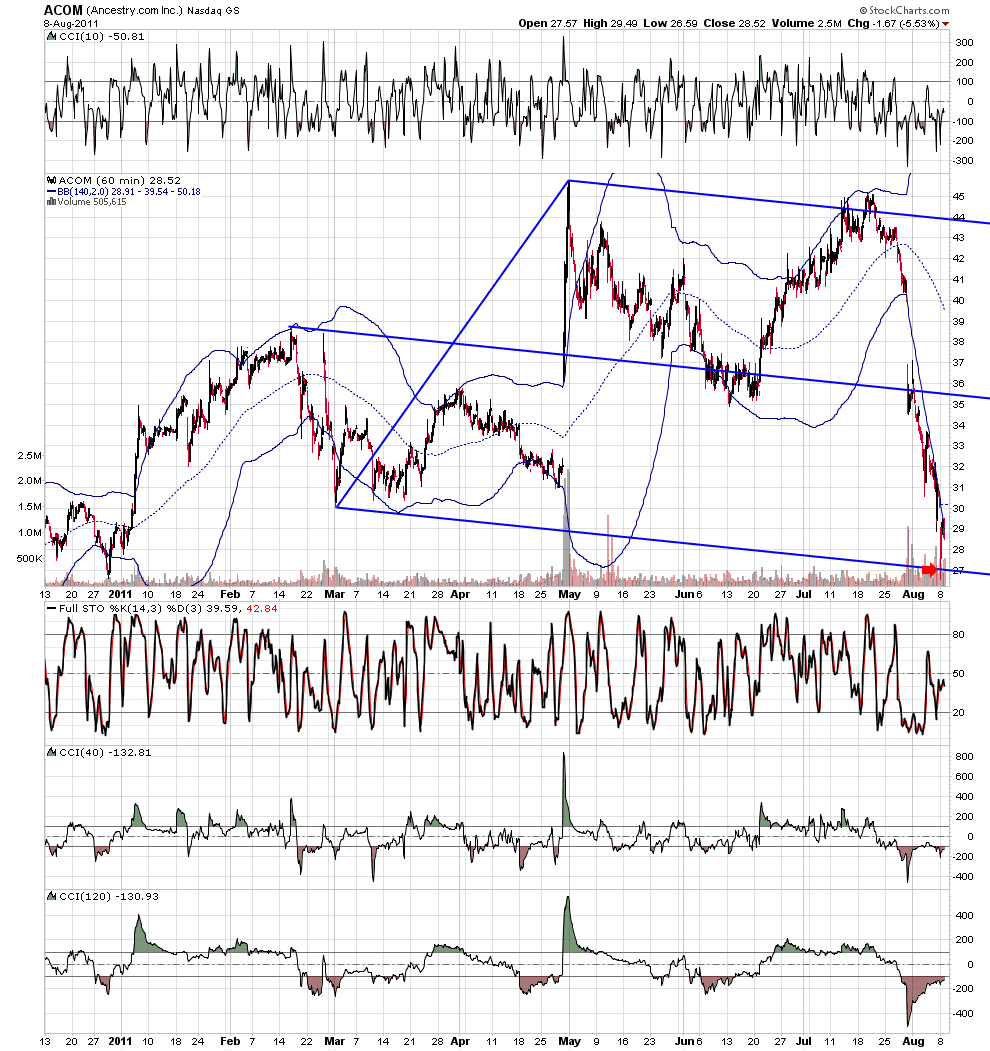
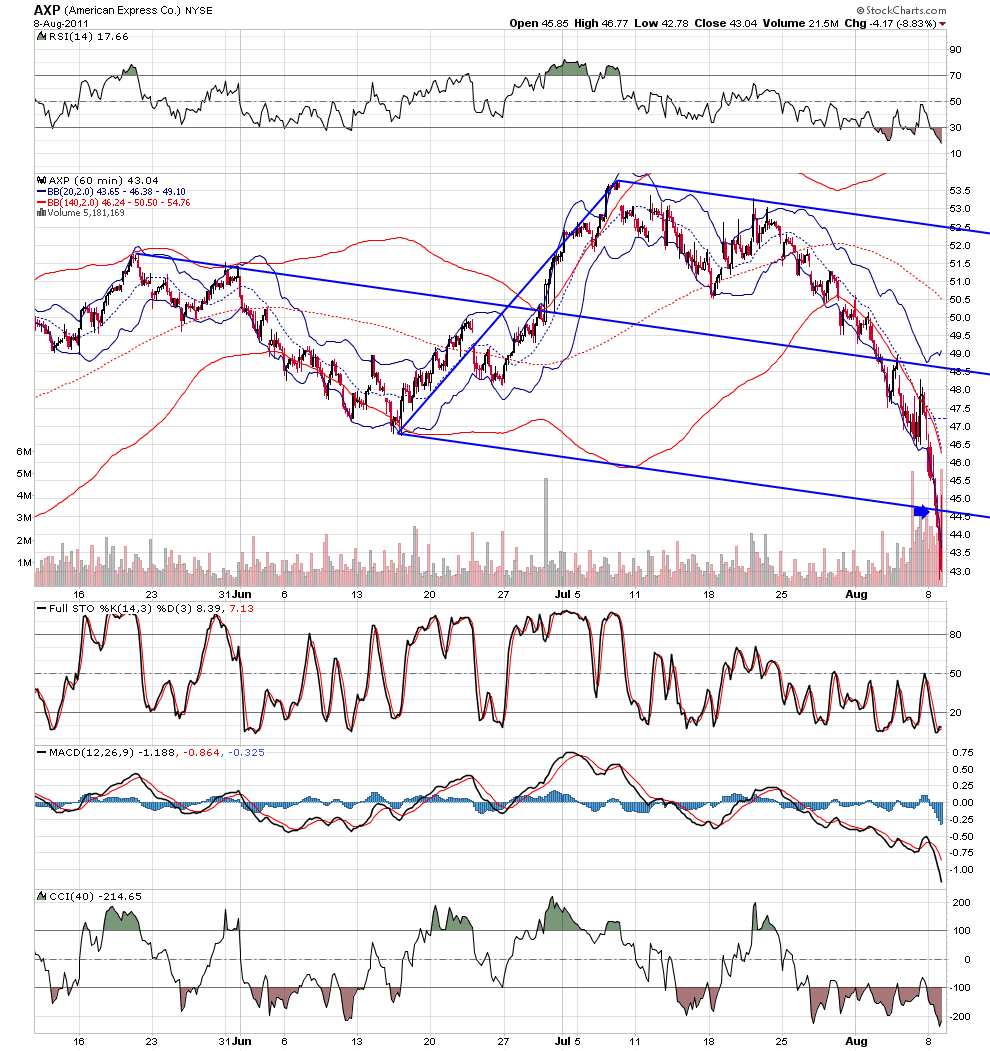
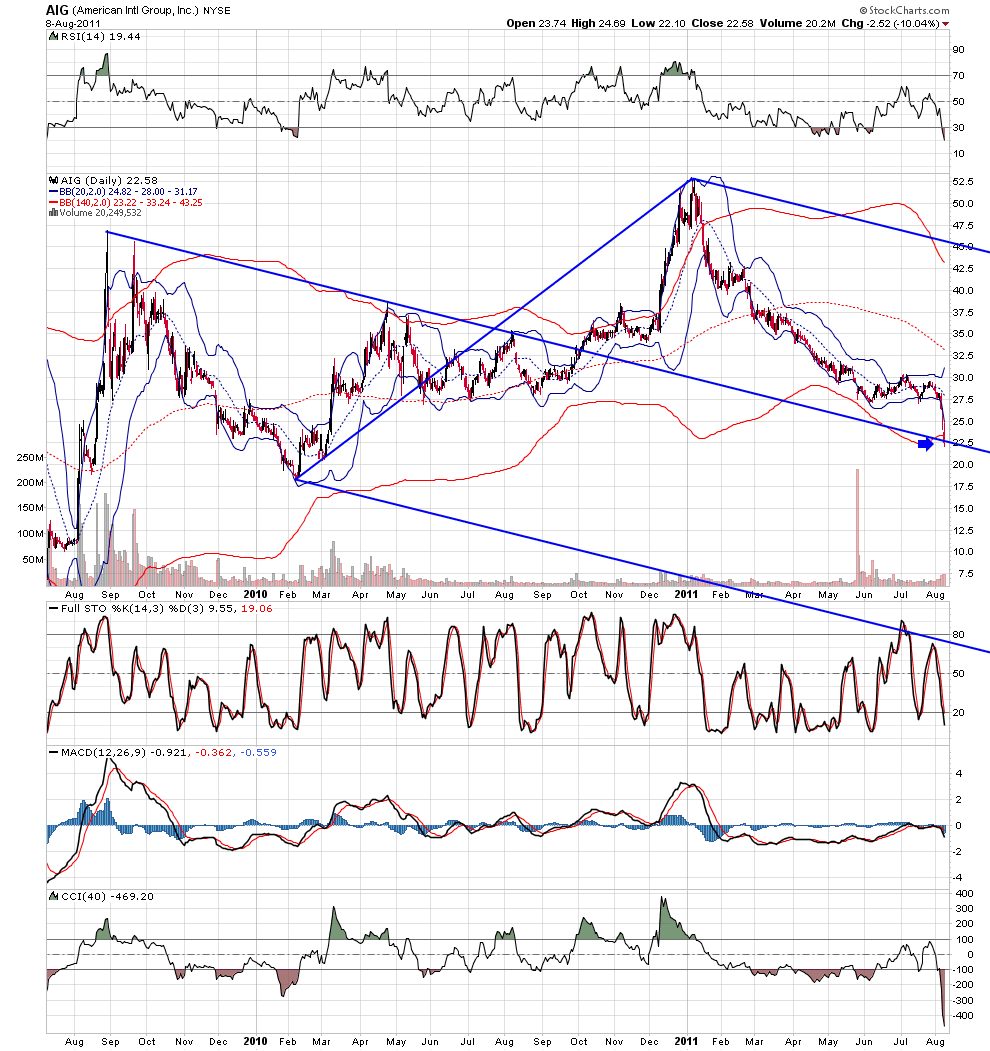
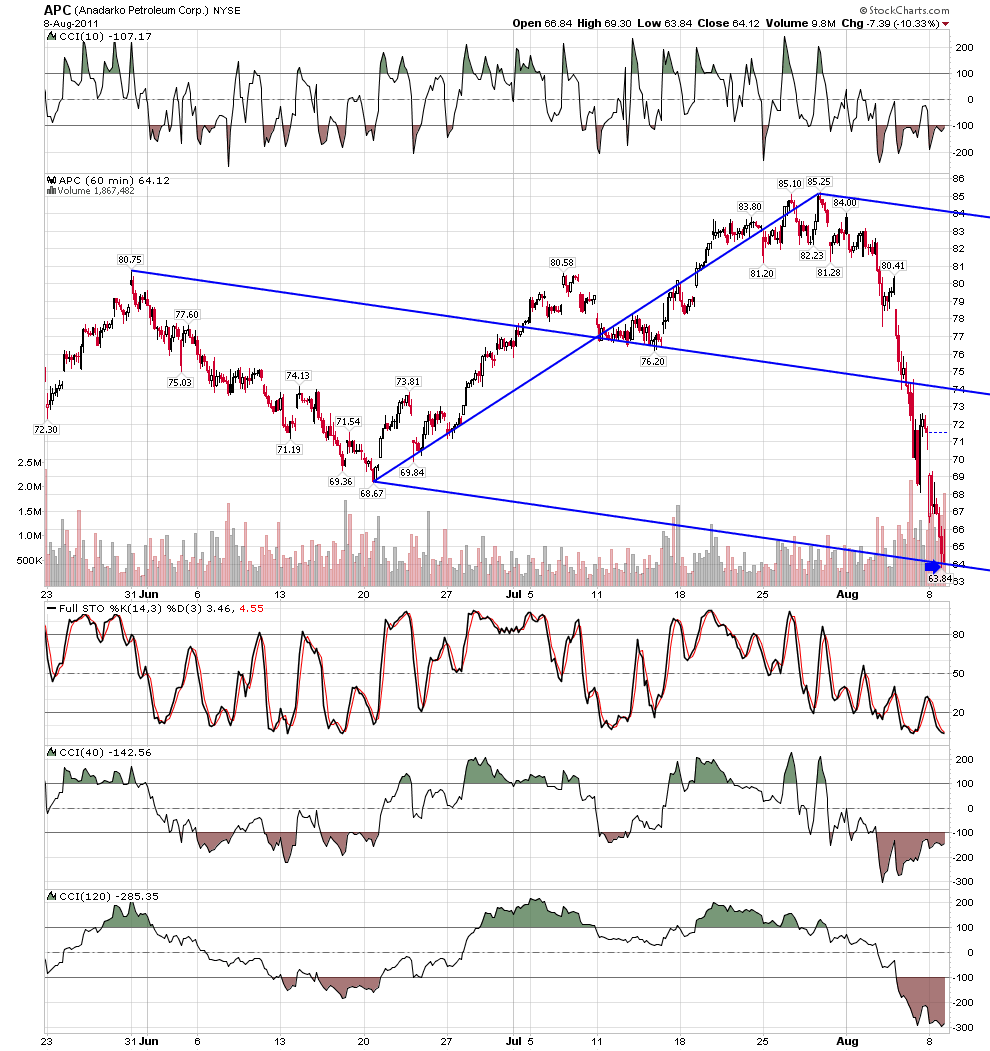
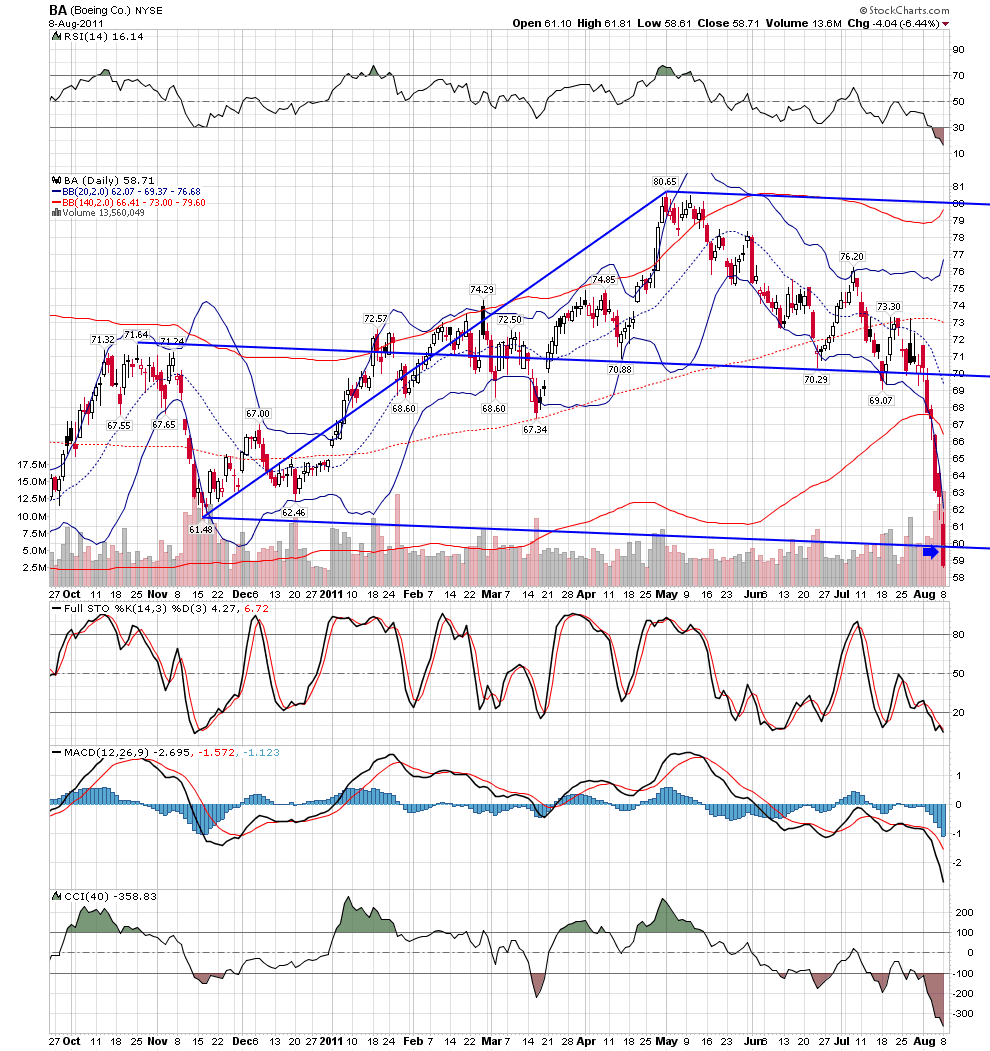
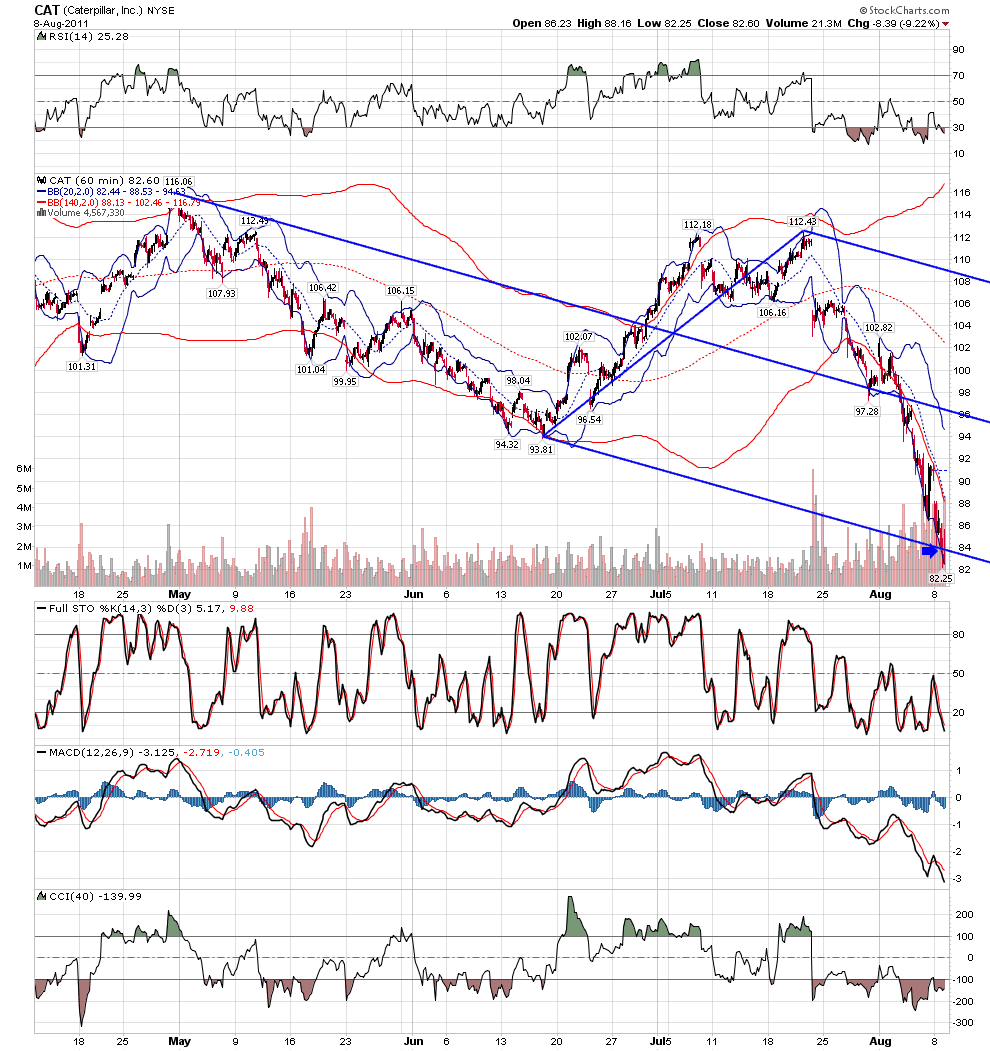
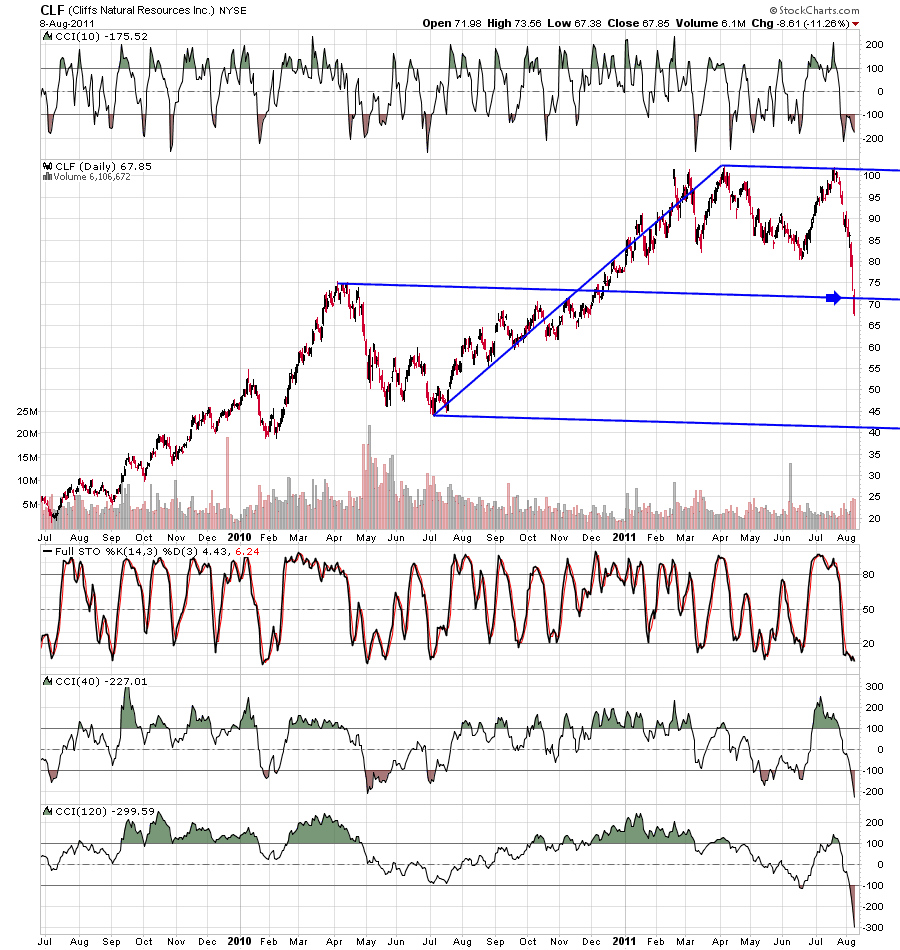
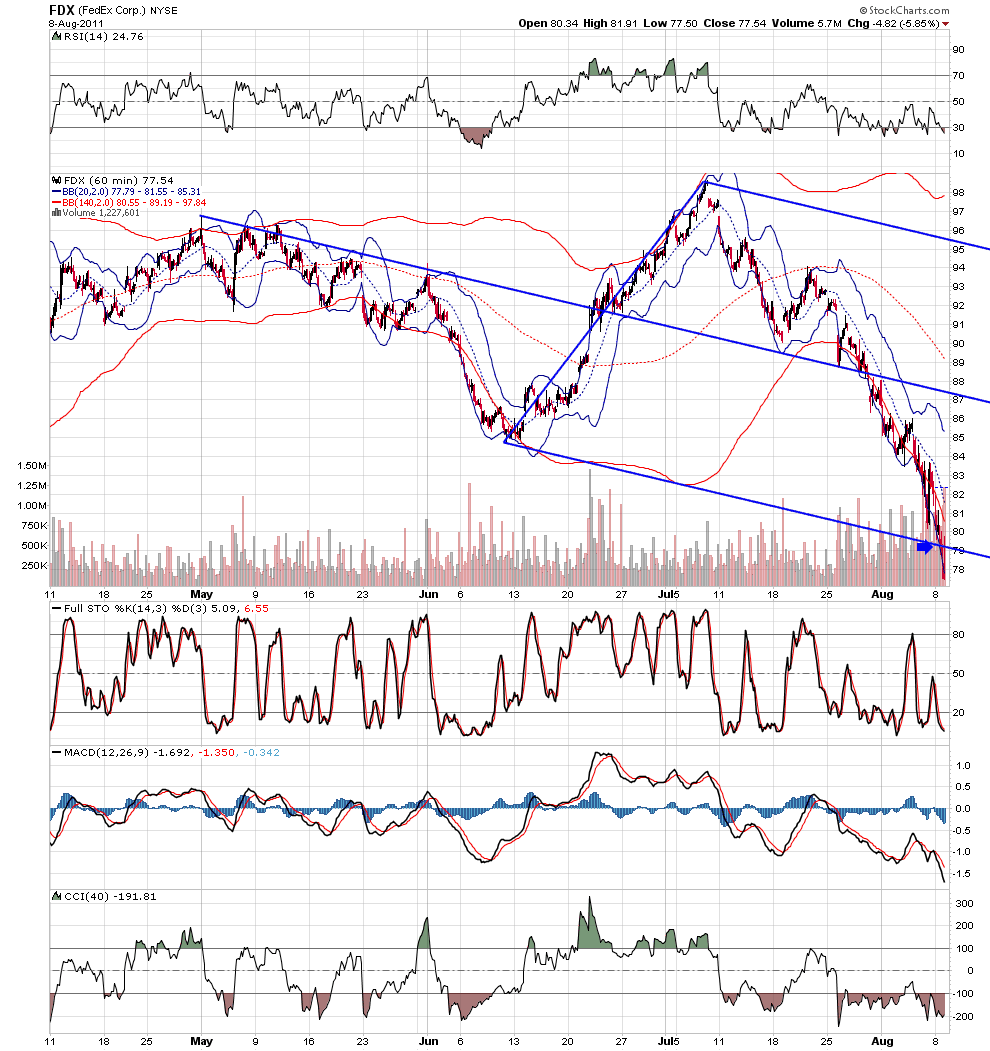
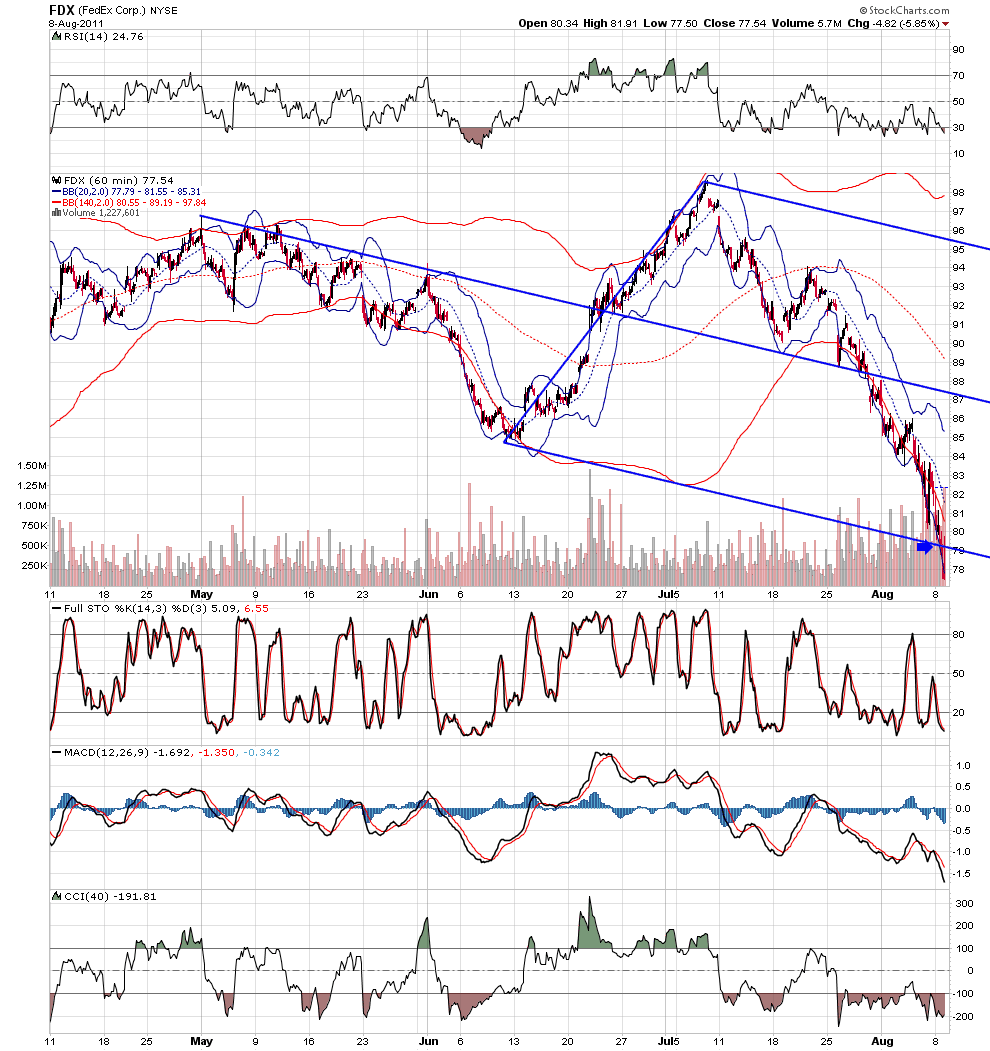
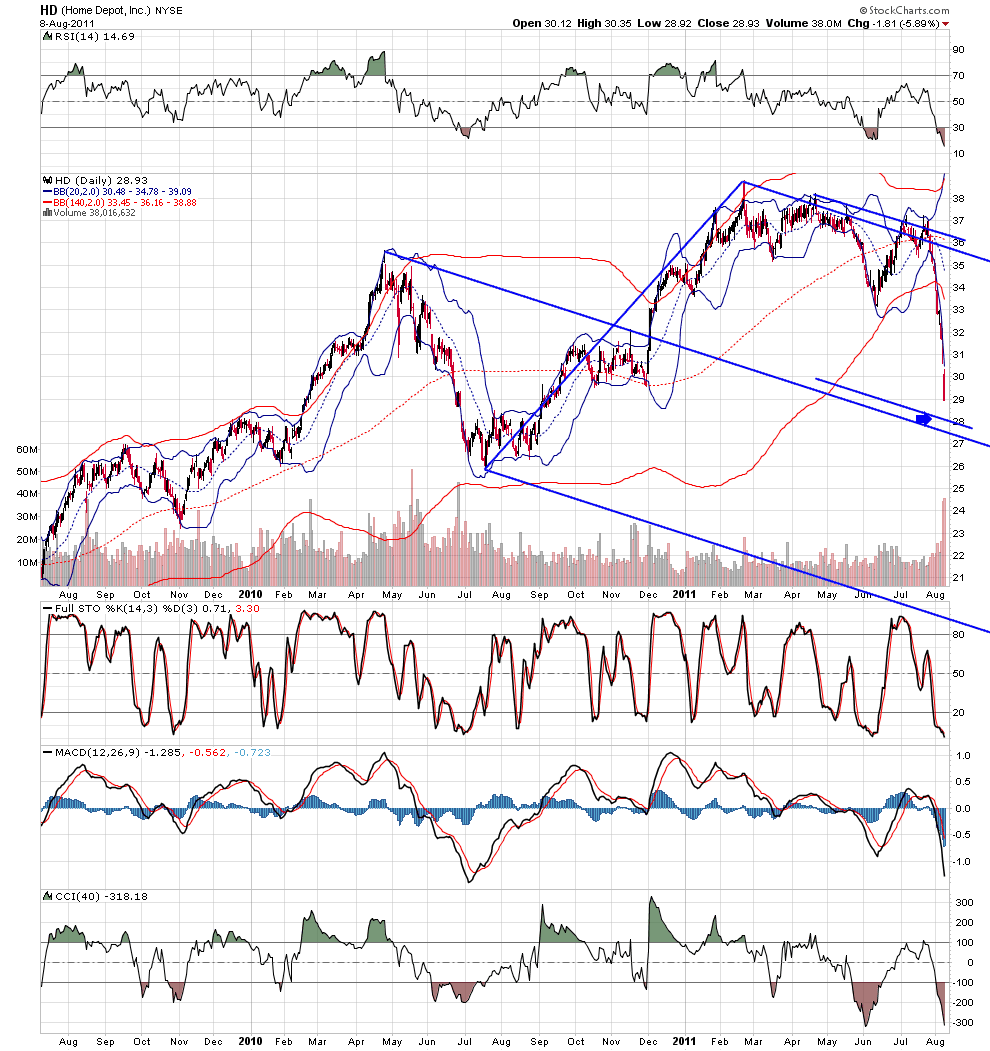
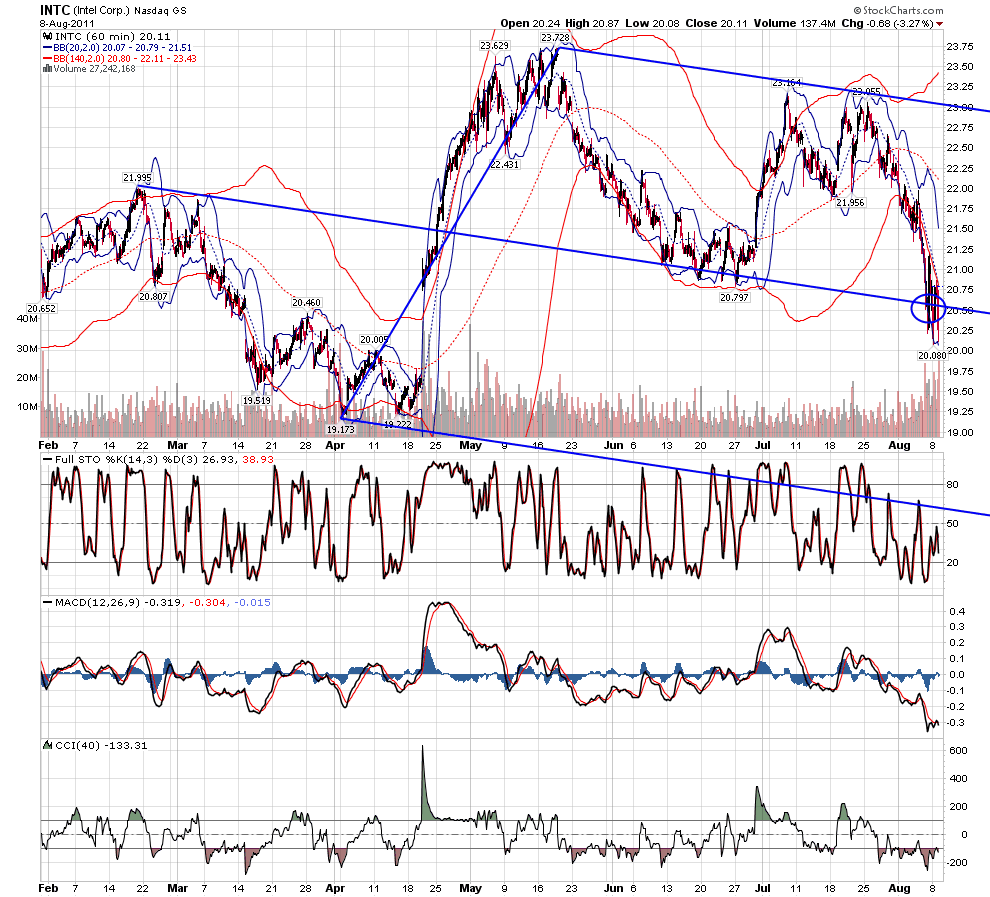
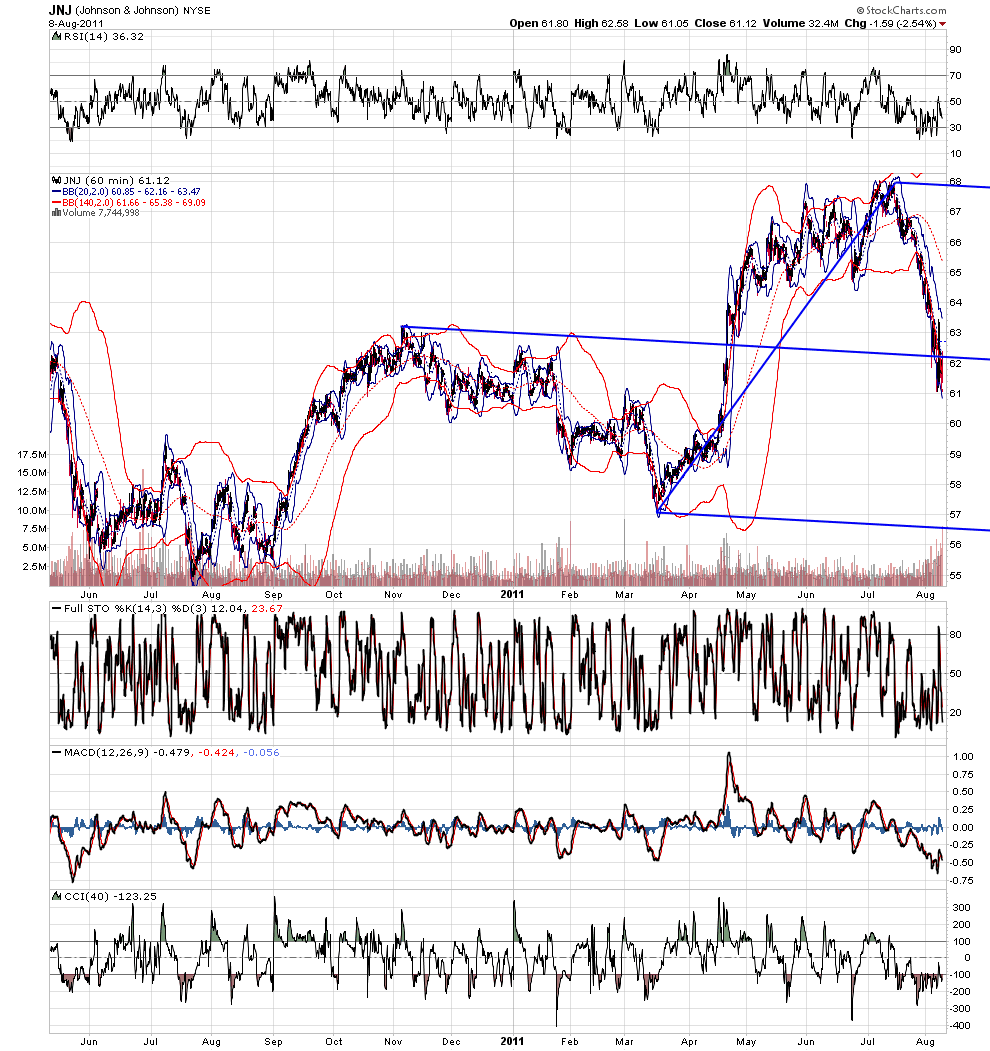
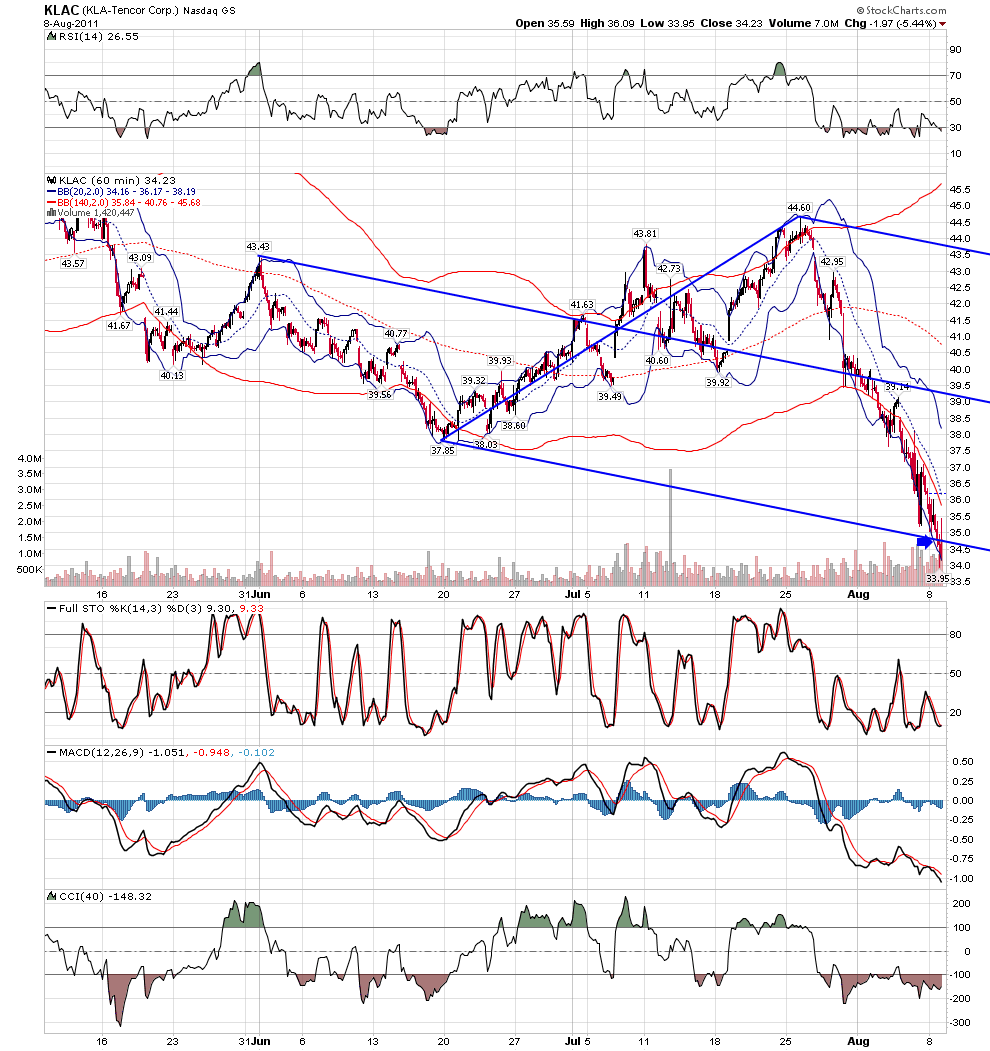
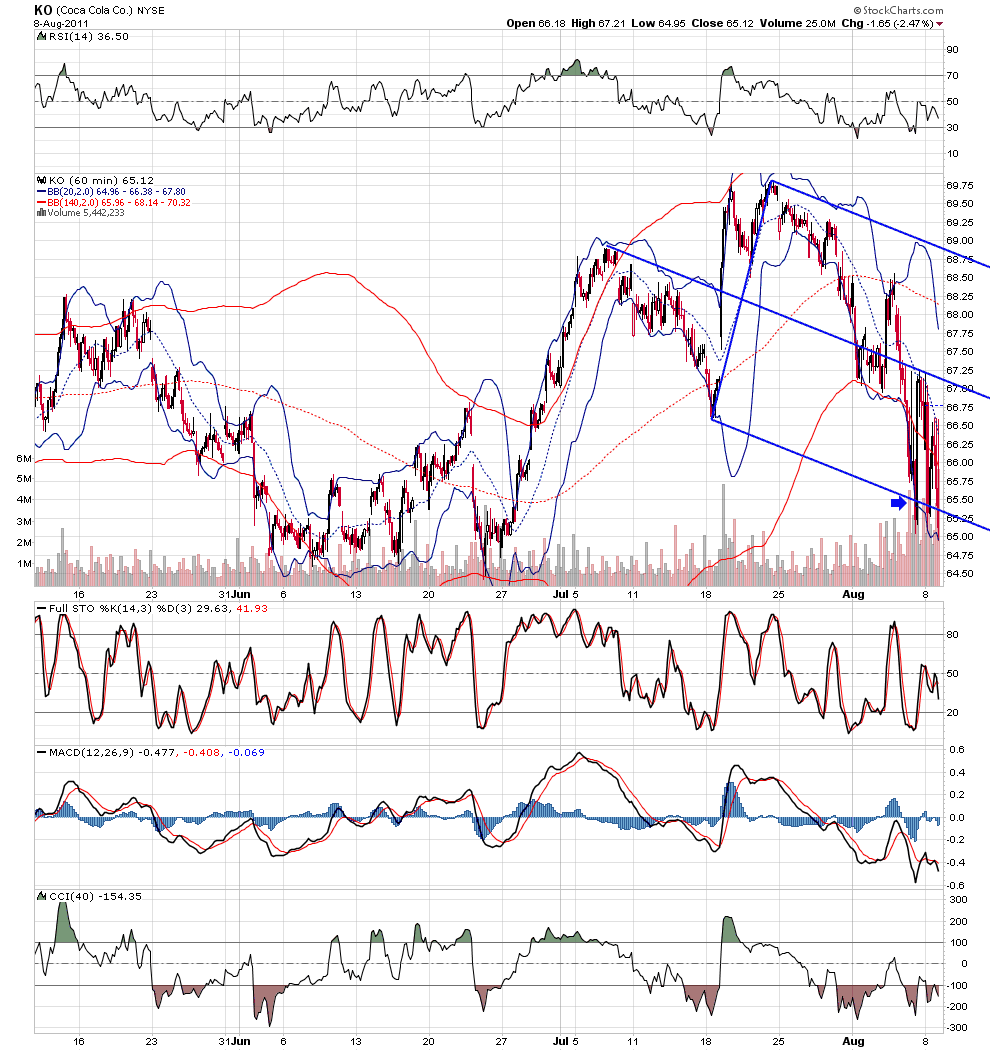
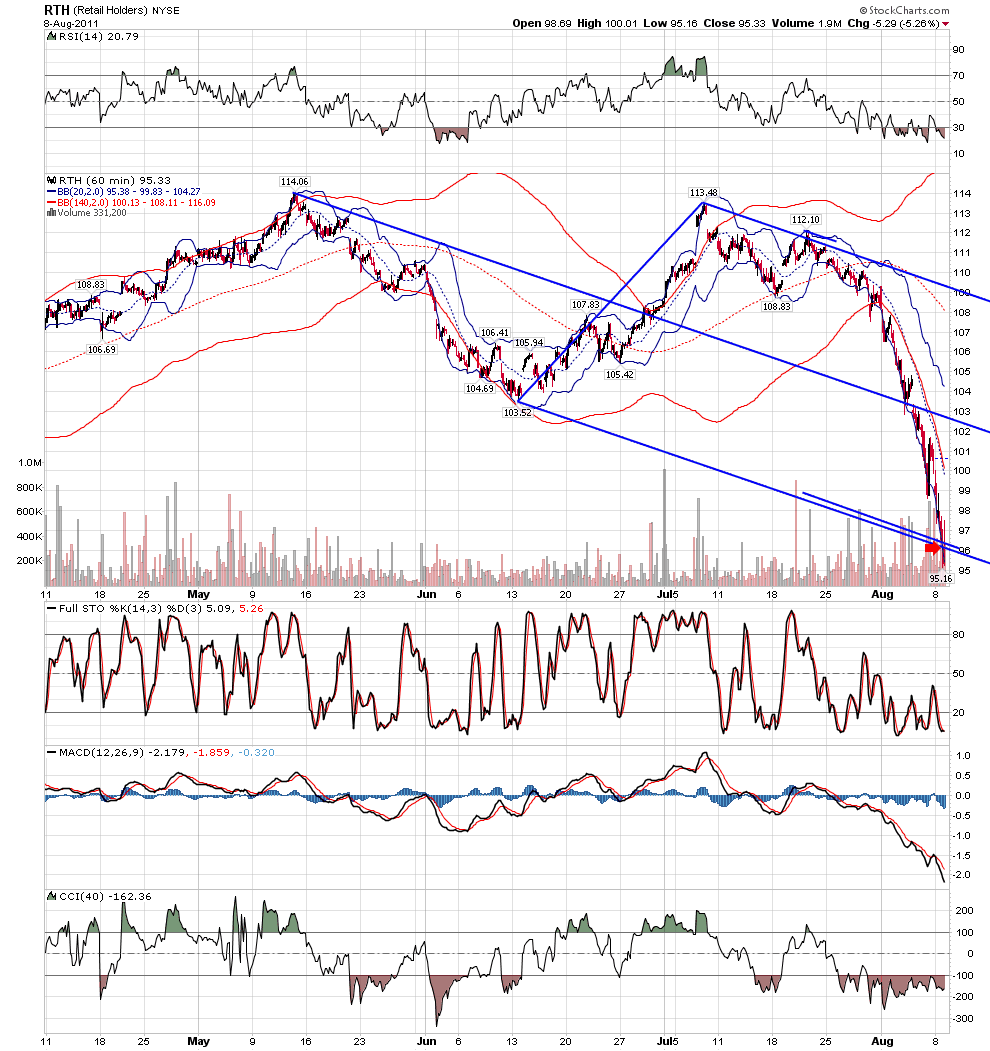
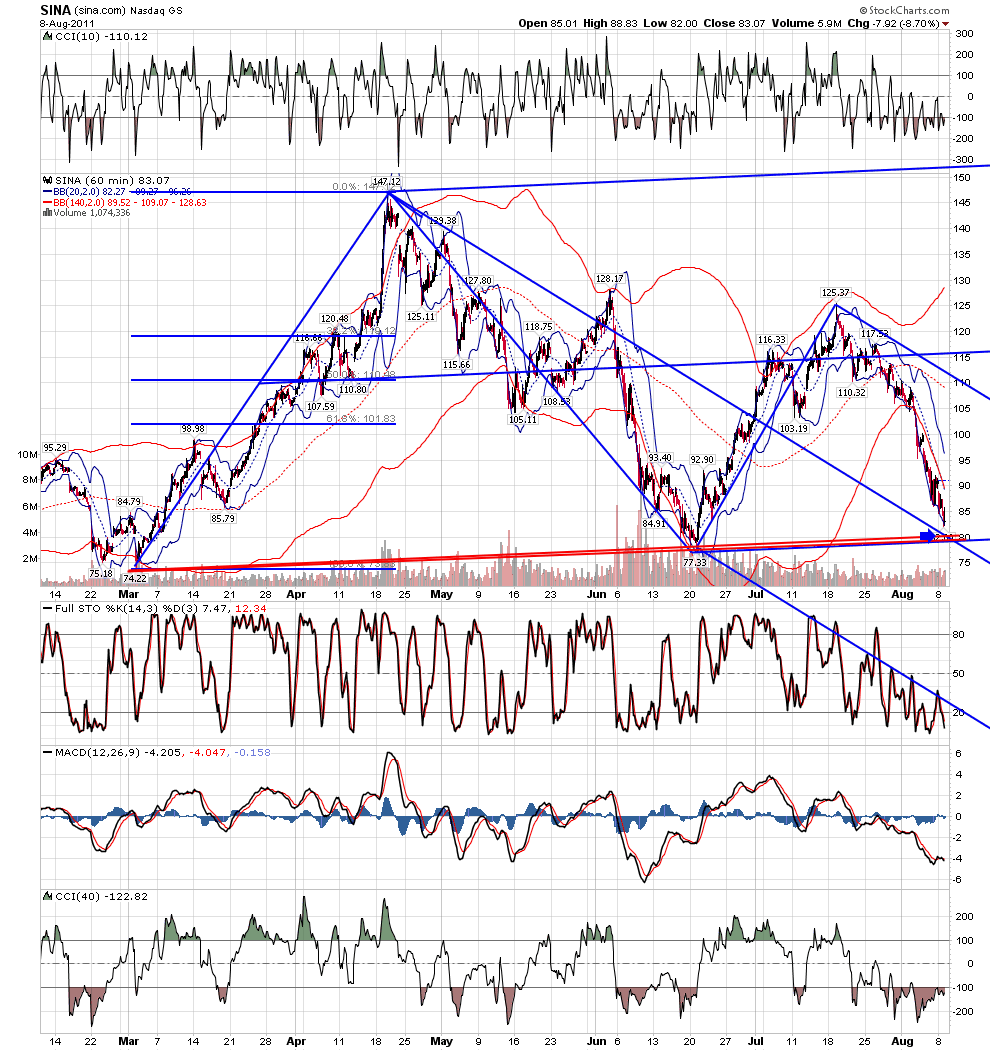
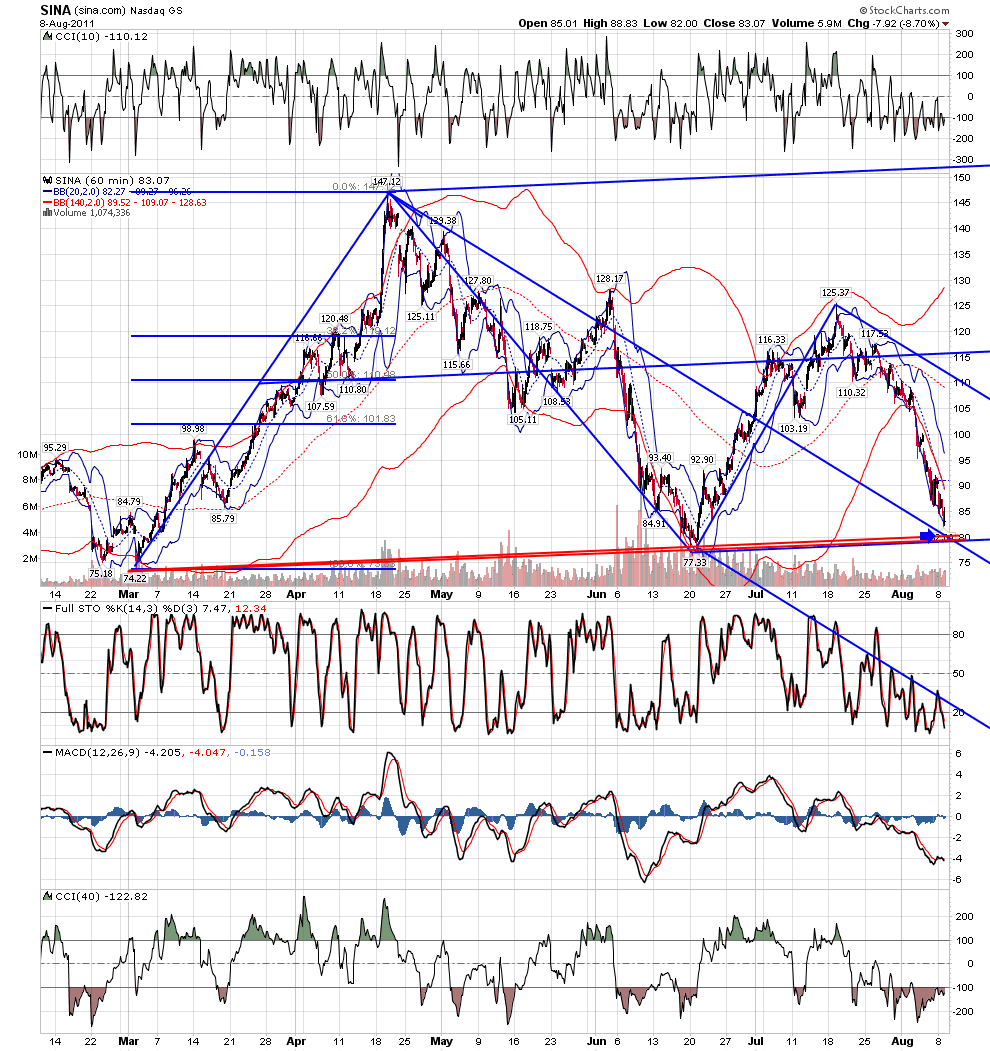
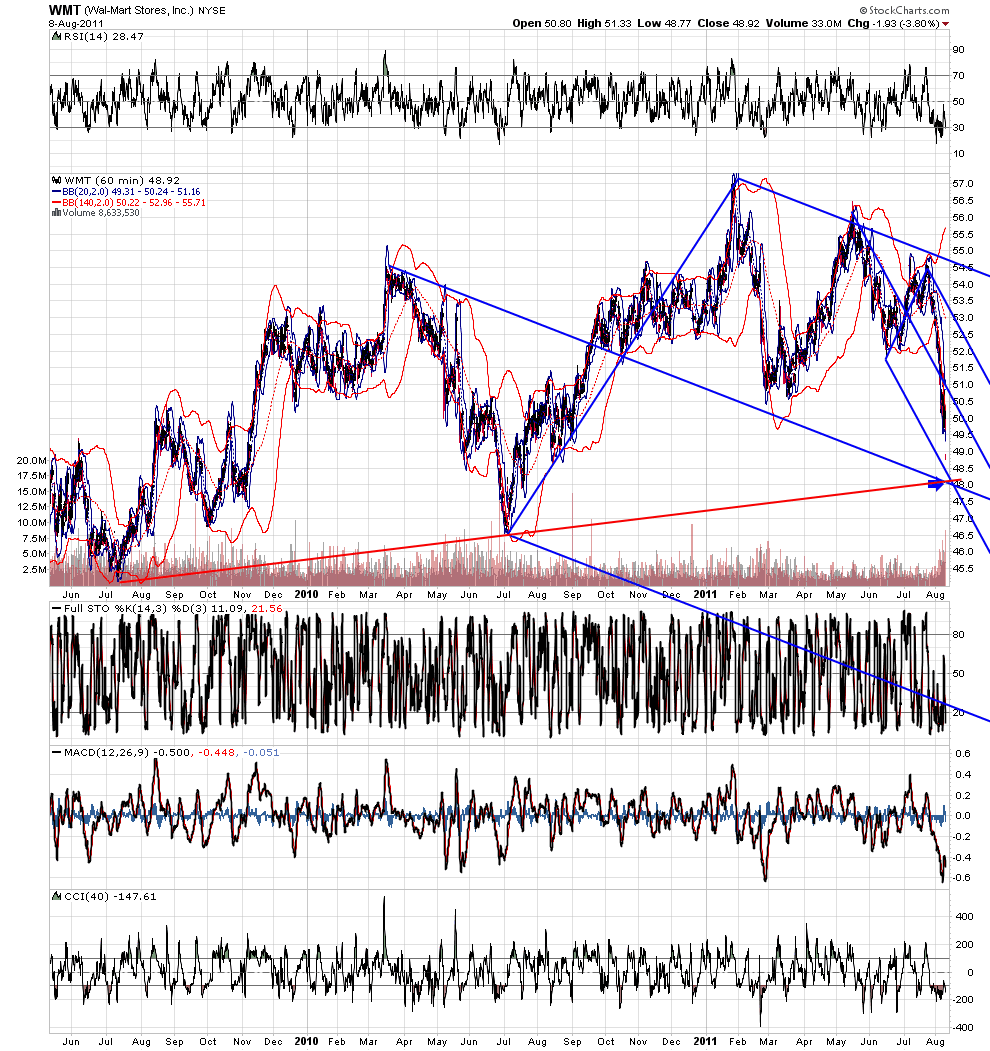
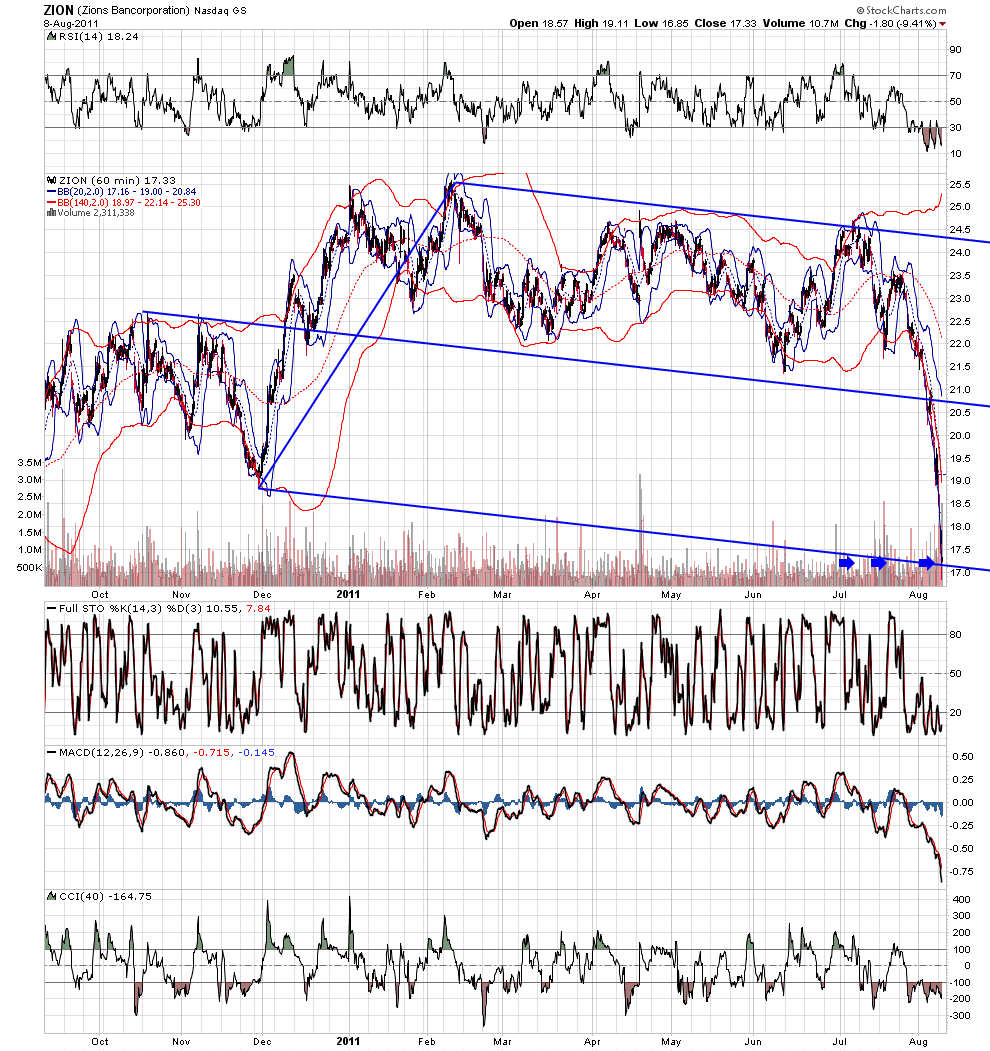
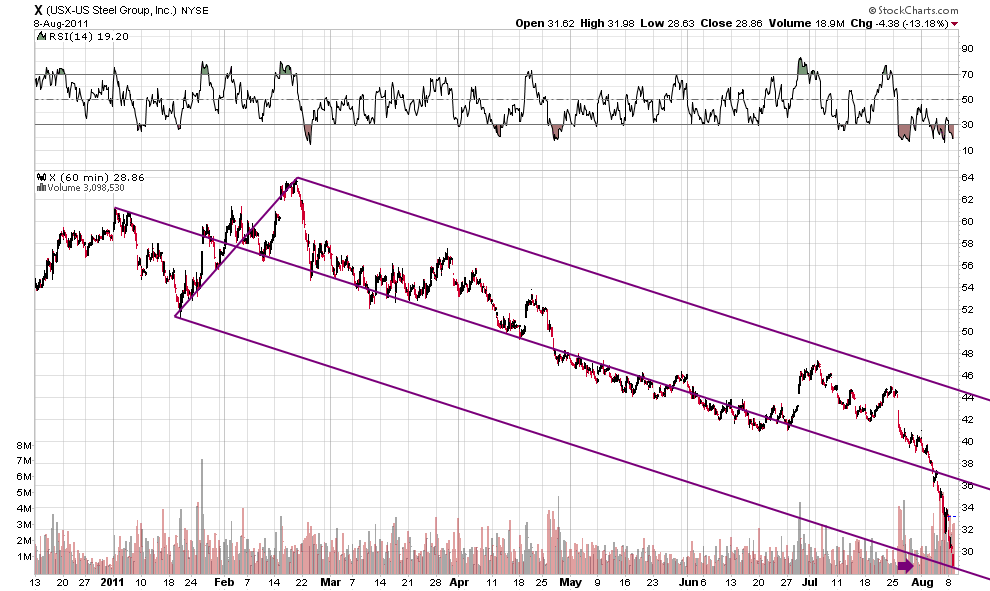
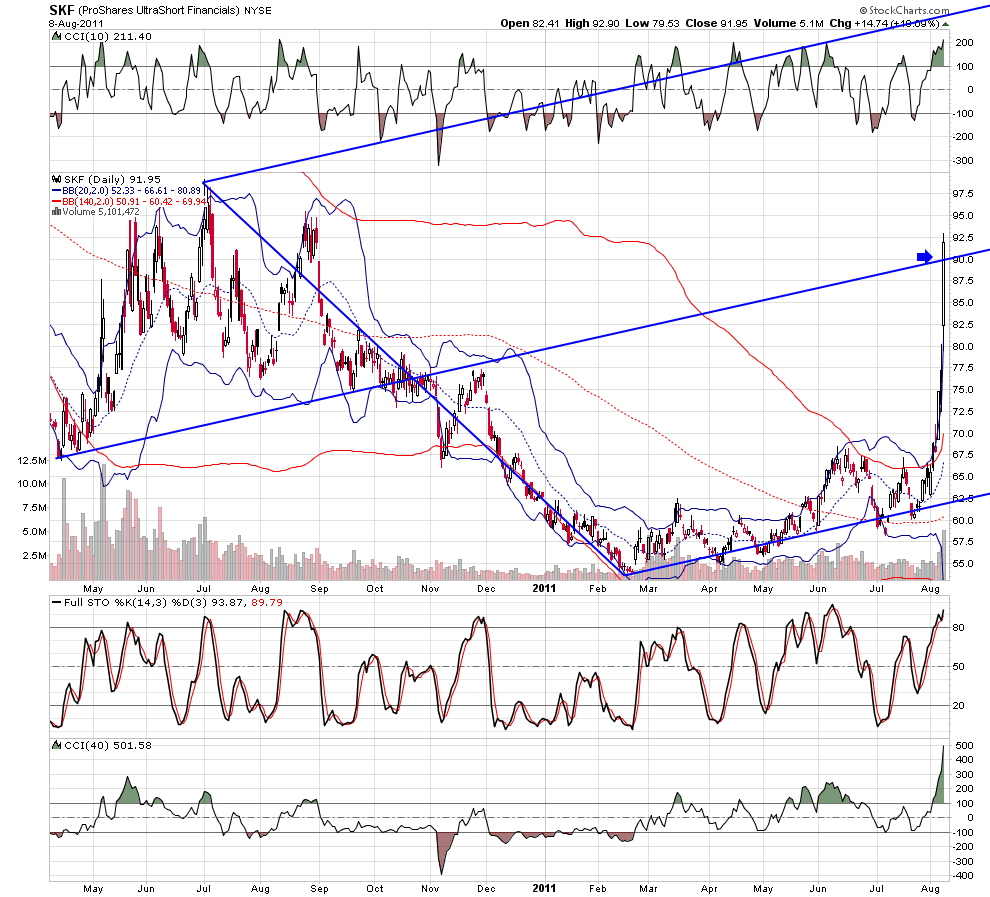
Looks like a really important time in the market. A nice time for the FED to do some inane action, or some other news, to give the excuse for reactions. One thing I will say, if these areas don't bounce these issues, watch out below, something huge is afoot.
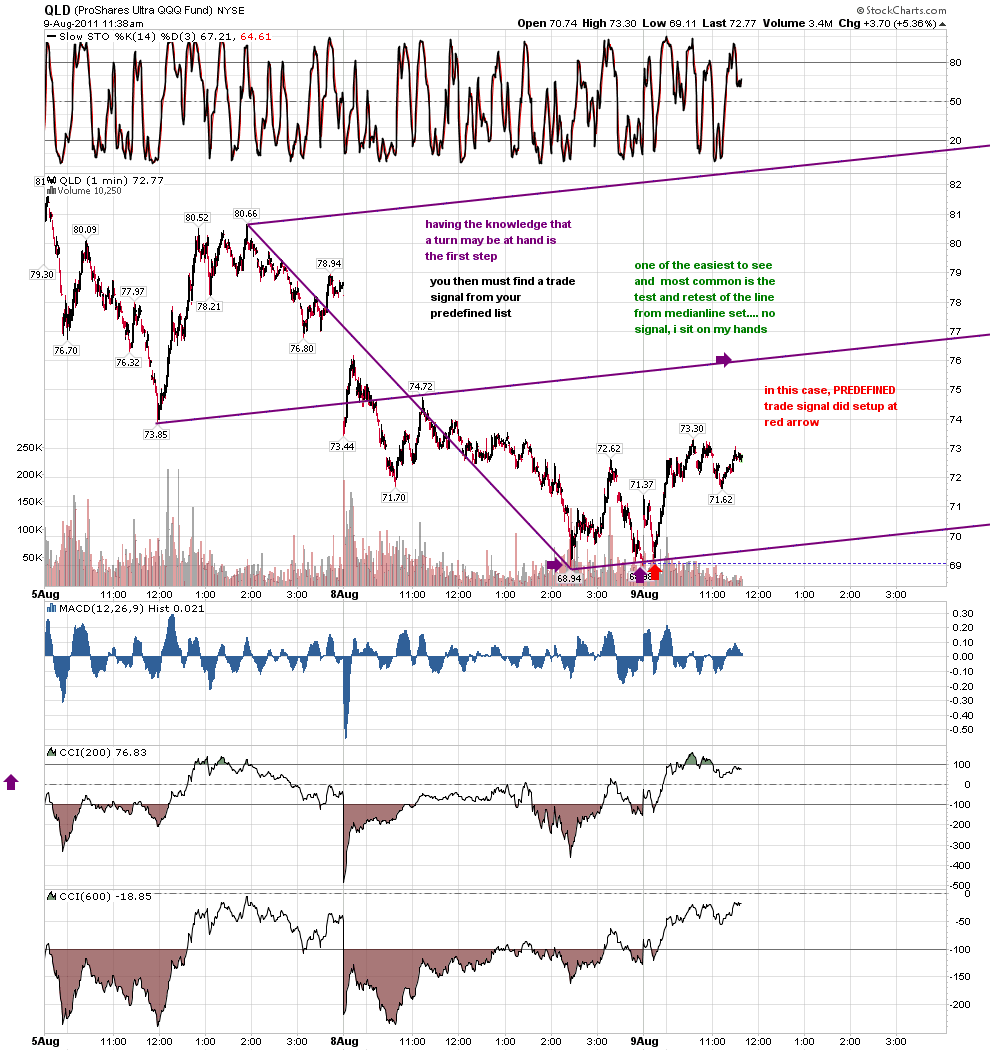
This is roofer's topic, so I don't want to hog it and say too much, but I will add one more thought. Most of these are 60-min charts. The daily and weekly sets imply much more downside, if that is what the market chooses to do. I am looking at one scenario where what we just had was 'wave 1' down, we get a big bounce for a 'wave 2', and then the big, sustained 'wave 3' type of a move. (I'm not a strict Elliottician, I'm just using the wave counts in a very general sense here.) That would likely take things down to the daily set lines. But, if they announce QE3 tomorrow, or soon, then all bets are off, and it may skyrocket. I'm just looking at scenarios, and if they start to unfold, I can use them as frameworks for trades.
Holey frickin' barbecued monkey meat roofer and Jim. Great graphics and analysis. I'm gonna spend some time (hours) going back thru the charts. Been trading the ES long into the night gettin' some pocket change from what should have been some bigger money. Much appreciated guys!
Emini Day Trading /
Daily Notes /
Forecast /
Economic Events /
Search /
Terms and Conditions /
Disclaimer /
Books /
Online Books /
Site Map /
Contact /
Privacy Policy /
Links /
About /
Day Trading Forum /
Investment Calculators /
Pivot Point Calculator /
Market Profile Generator /
Fibonacci Calculator /
Mailing List /
Advertise Here /
Articles /
Financial Terms /
Brokers /
Software /
Holidays /
Stock Split Calendar /
Mortgage Calculator /
Donate
Copyright © 2004-2023, MyPivots. All rights reserved.
Copyright © 2004-2023, MyPivots. All rights reserved.
