ES Tue 8-2-11
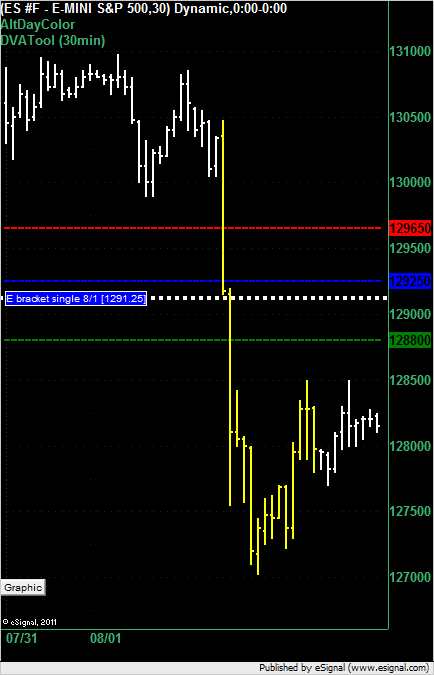
Market profile single print left at 1291.25 during the Monday trading session. Market currently trading under it.
Copied these replies from the Value Area and POC topic:
Originally posted by gus
If I understand the concept, Tuesdays high should be 1291.25 area, where a short should be entered. Correct? Tnx Gus aka August
Originally posted by john newton
no-the high could be 1283 ish but no one knows for sure-if it doesnt break that 1283 i would probably short there at 1283.50-not investment advise
Originally posted by john newton
p.s. the camarilla method would have you shorting tomorrow in that 1290 ish area if its not broken to the upside-you might want to learn both -good luck
I am still confused about single print. I would have thought a sindle print is a topping or a bottoming tail representing exxhaustion
I would have thought that the first linne of resistance would be 1283.25 which is a single print and where you had a failure at the close. The next resistance level is the breakdown candle with open at 1291.75. I use thinkorswim platform to look at charts
I would have thought that the first linne of resistance would be 1283.25 which is a single print and where you had a failure at the close. The next resistance level is the breakdown candle with open at 1291.75. I use thinkorswim platform to look at charts
prave
in your post, notice that the words single print are a gateway to a definition. click and read.
in your post, notice that the words single print are a gateway to a definition. click and read.
Thank you for your response. I do not have MP software which shows single prints as single letters. I use Thinkorswim platform where they allow you to set up user defined time brackets, 30 minute or higher or lower and plot VAH/VAL AND POC . Within the bracket however you cannot identify single prints
Praveensuri - if you have the letters (TPO's) on your chart then you should be able to visually identify single prints. Not all software automatically draws a line like on the chart above. You have to manually find the single print and manually add the line to your chart. Was that your question?
dt,
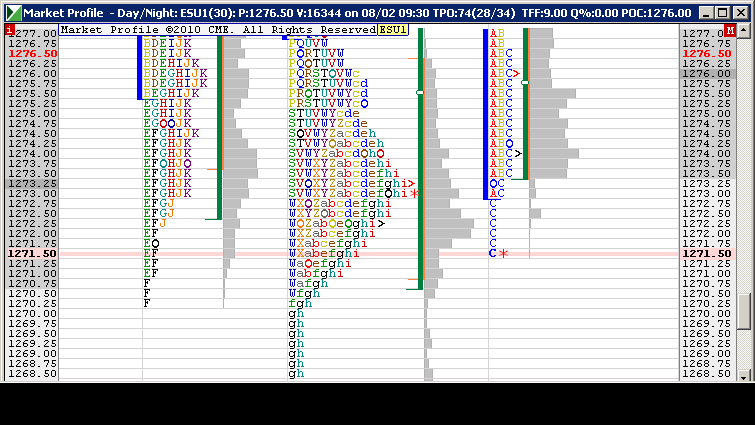
does POC mean anything in MP?
I'm asking because when I look at my chart, I think the POC from yesterday was 1280 something
Yesterday's close was 79.75.
all price did this morning was close the 4:15 gap and print at the POC.
isn't the POC first test some sort of potential reversal area? I don't know. that's why I am asking.
Paul, POC is best used as a target, as there is often a reaction once it reached. By definition it is an area where market is in balance - no incentive to initiate trades, as that is where "driving" buyers meet most sellers.
Of course, news drive through any support/resistance
Of course, news drive through any support/resistance
Is anyone out thereeeeeeeeeeeeeeeeeeeeeeeeeeee
thanks LisaP
Market just "took out" O/N POC (see grey volume area). I am watching the response. IF we bounce, I will get on board. If we continue to fall, all those traders who initiated longs at this POC are "losers" and they will bail driving the market further down.
BTW, NQ is at support, so I am watching that too.
BTW, NQ is at support, so I am watching that too.
Originally posted by apk781
fyi, the deal passing was almost a certainty, that is why you saw no reaction. Same thing with the voting in the house yesterday
the reaction to the debt deal agreement was on the open on sunday but it was overshawdowed by the poor economic data yesterday and today, along with sovereign woes in europe.
Ark, of course you are right. Trouble is we never know what news are important. I thought that trouble in EuroZone would roll the money into US market, but I was wrong.
BTW, the NQ gap is now closed. Anal MFs (pardon).
Emini Day Trading /
Daily Notes /
Forecast /
Economic Events /
Search /
Terms and Conditions /
Disclaimer /
Books /
Online Books /
Site Map /
Contact /
Privacy Policy /
Links /
About /
Day Trading Forum /
Investment Calculators /
Pivot Point Calculator /
Market Profile Generator /
Fibonacci Calculator /
Mailing List /
Advertise Here /
Articles /
Financial Terms /
Brokers /
Software /
Holidays /
Stock Split Calendar /
Mortgage Calculator /
Donate
Copyright © 2004-2023, MyPivots. All rights reserved.
Copyright © 2004-2023, MyPivots. All rights reserved.

