ES 7-13-11
Void below. Island reversal, Daily chart gaps. Looks good. Maybe too good.
Diagonals create their own support if you think about it. That's why I'm thinking it about the only possibilty left for higher.
Projecting from 1295.25 low gives a minimum 5th wave of about 1380.
I know, doesn't seem likely.
Also, diagonals are made of 3 wave moves.
Free your mind?
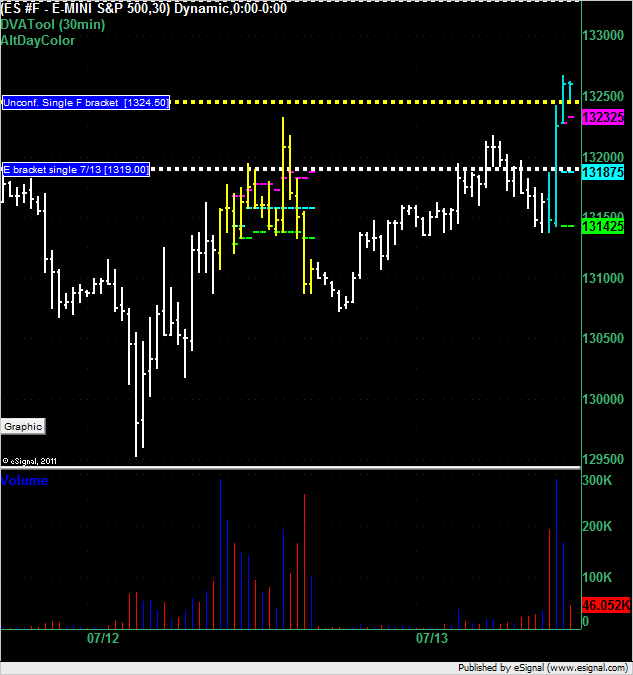
1325 and 1332 above.
1320 and 1317.25 below.
had started a separate thread so copying what i posted into this one
I had penciled the 22-22.5 area as possible stop zone if we jumped up after bernake's statement was released..was able to sell 22.25 for a quick 2.25 pt profit, still have a few runners on aiming for 19 although they look like they will get stopped at breakeven ....they did, as i write...
coming back to the area mentioned, i had two fib projections coming from the 5 and 15 min charts, 4.23x of the stretch there as well, while nq and ym were at local support
i prefer to sell rallies here so above here i still have 24.5-25 as a possible stop zone although i will wait for 27 (having taken the short mentioned above). Have a bunch fib projections there from my intermediate charts as well as the high/single print from monday...above 27 i have 31 (hourly and 30 min projection), although i hope we don't get there...
first set of single prints wil have formed at 19 by 10:30am
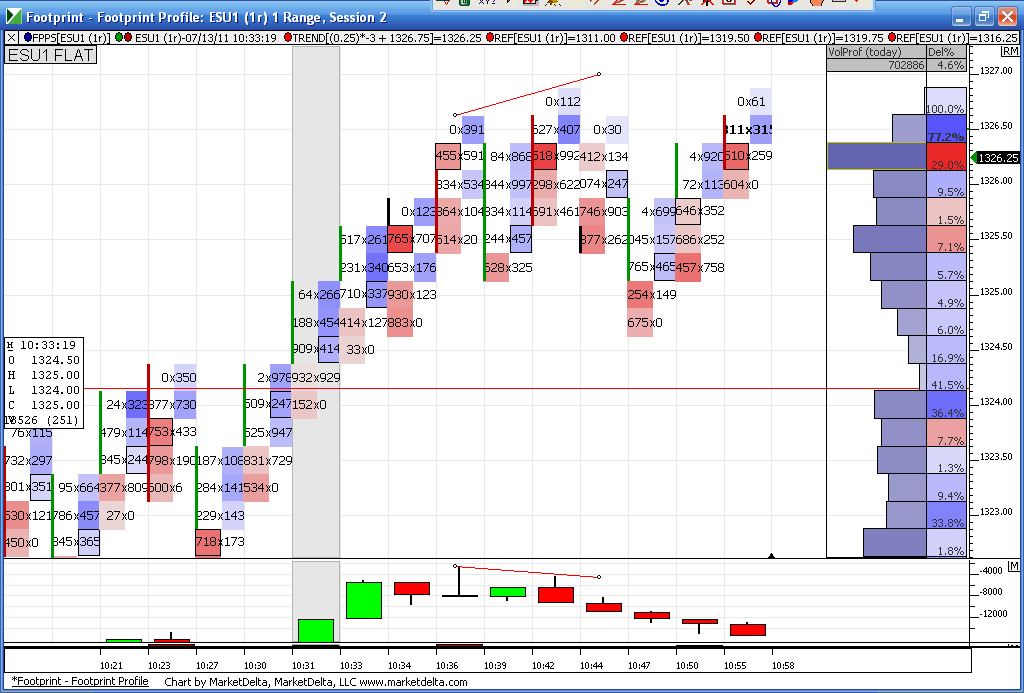
Finally a divergence up at 1326.....so trying shorts now up here..targeting 24.25..
Caveat is, it is what it is. Mind those levels as even a diagonal has sharp corrections.
Banks have a bid today so far.
The alternative would be at least an equal move down or more. Think sub 1280.
Gotta love it!
Banks have a bid today so far.
The alternative would be at least an equal move down or more. Think sub 1280.
Gotta love it!
If they don't come back to 24.25 then this will be the second set of singles on the day..interesting that this little push up is happening with negative delta...I have drawn the mini trendline so u can see the divergence and why I took this trade
same here bruce, just short from 26.5, right on the 27 area i mentioned...targeting 24.5, second set of prints
have to say i don't like how long we are hanging up here, so i hope 24.5 comes quick !
have to say i don't like how long we are hanging up here, so i hope 24.5 comes quick !
Originally posted by BruceM
Finally a divergence up at 1326.....so trying shorts now up here..targeting 24.25..
i meant to say potential set of prints...sorry for the confusion
Originally posted by apk781
same here bruce, just short from 26.5, right on the 27 area i mentioned...targeting 24.5, second set of prints
have to say i don't like how long we are hanging up here, so i hope 24.5 comes quick !
Originally posted by BruceM
Finally a divergence up at 1326.....so trying shorts now up here..targeting 24.25..
obviously didn't reach target but we still have divergence so I will be looking for sells again...above this 90 minute high and the 7-11 high of 1327 !! we still have one tic of single prints at 24.25....
added at 27.5...will take these off at 25.5 and still aiming for 24.5 on the previous sell (26)
previous sell was 26.5, not 26...typing was never my thing
Originally posted by day trading
Originally posted by Big Mike
Great info DT. One question, is that a typo on the "E" candle? I can't see how 9:00 CT is "E"?
Traditionally the D candle starts at 8:30CT and the E at 9:00CT. If you look at the Market Profile Calculator you'll see that it defaults to D as the first bracket.
More great info! Thanks DT.
Emini Day Trading /
Daily Notes /
Forecast /
Economic Events /
Search /
Terms and Conditions /
Disclaimer /
Books /
Online Books /
Site Map /
Contact /
Privacy Policy /
Links /
About /
Day Trading Forum /
Investment Calculators /
Pivot Point Calculator /
Market Profile Generator /
Fibonacci Calculator /
Mailing List /
Advertise Here /
Articles /
Financial Terms /
Brokers /
Software /
Holidays /
Stock Split Calendar /
Mortgage Calculator /
Donate
Copyright © 2004-2023, MyPivots. All rights reserved.
Copyright © 2004-2023, MyPivots. All rights reserved.

