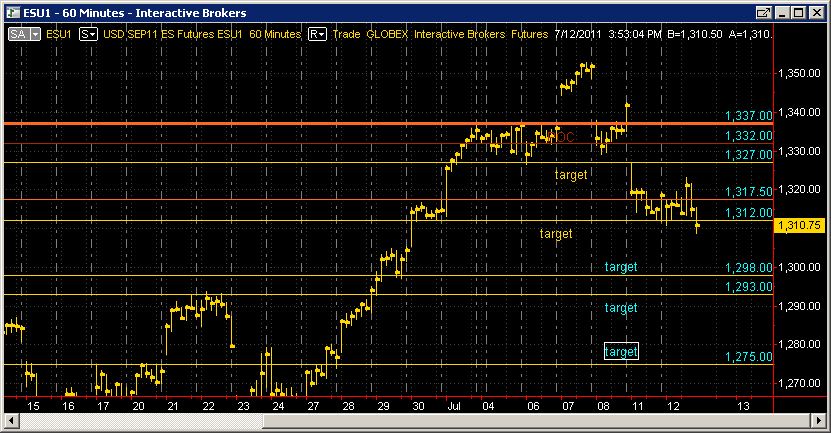
ES TUES 7-12-11
The overnight Low was 1295.25
50% of last month's RTH range = 1294.00
50% of last month's 24hr range = 1297.25
IMHO, Low for the 24hour is probably already in
This is OpEx week. specialists have already sucked the premium out of the calls. Maybe it's time for them to sell the premium inflated Puts before they come in with fists-o-cash to push prices higher for a premium wipeout of the puts.
50% of the current week is 1317.25, Pivot (RTH) for today is 1319, this zone should be tagged.
CNN: President Obama warns in a CBS News interview that, absent a deal on the debt, he can't guarantee Americans will continue to receive Social Security checks.
Good to see Cum Delta might be helping. It takes time for our brains to synthesize new concepts. Plant a seed and wait to see what grows.
Moody's cuts Ireland to junk, warns of 2nd bailout
Lisa,
void because of "Moody's cuts Ireland" comment?? Sorry that's one chart I DO HAVE... why is it void?
thanks in advance!
void because of "Moody's cuts Ireland" comment?? Sorry that's one chart I DO HAVE... why is it void?
thanks in advance!
Originally posted by TradeQueen
Lisa,
void because of "Moody's cuts Ireland" comment?? Sorry that's one chart I DO HAVE... why is it void?
thanks in advance!
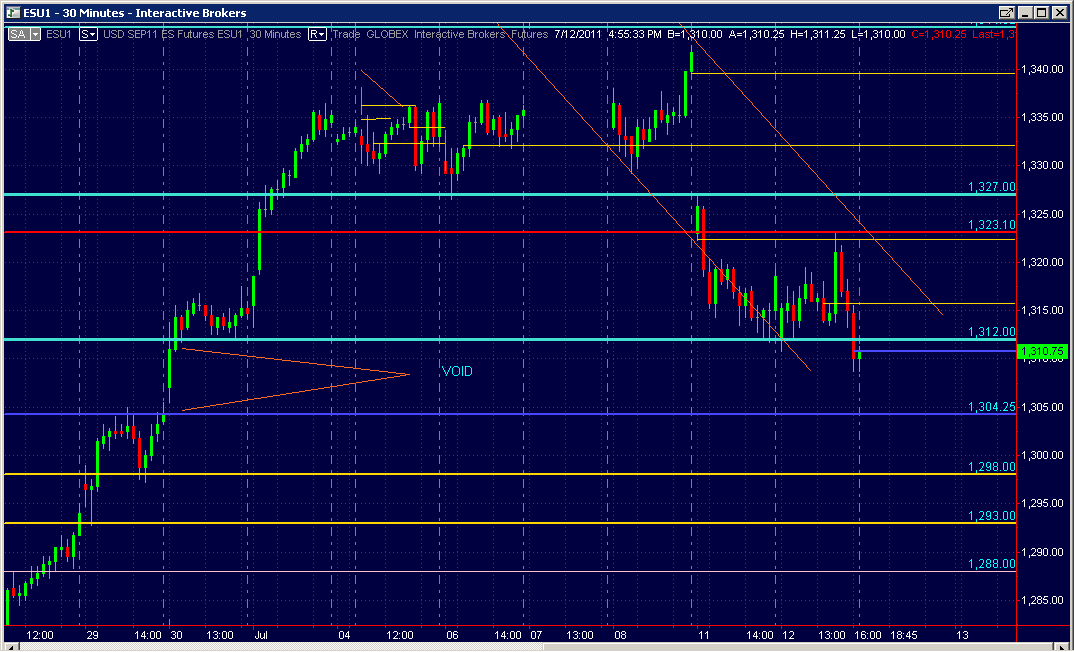
TQ, Below is the 30-min chart.
Look at the quick rise of 30 June. No pullbacks, no overlaping bars - which means no support and no resistance. If you look at your MP chart, you would see "single prints" from 134.50 to 1310.50 - that is what I call a "void". Price moves very fast in the "void", as traders tend to take positions at support or resistance - and there is none.
So if Asian and Euro traders push the market down on today's news, there is no support until at least 1304.50 (gap close), or at 1298). We may wake up there, unless Euro ministers would cook something up tomorrow.
Hope that helps. Please let me know if you read it tonight. IF not I will post a note tomorrow. Here is the 30-min chart.
Sorry should read "..."single prints" from 1304.50 to 1310.50"
No worries... Many thanks! g'night
Originally posted by Lisa P
Sorry should read "..."single prints" from 1304.50 to 1310.50"
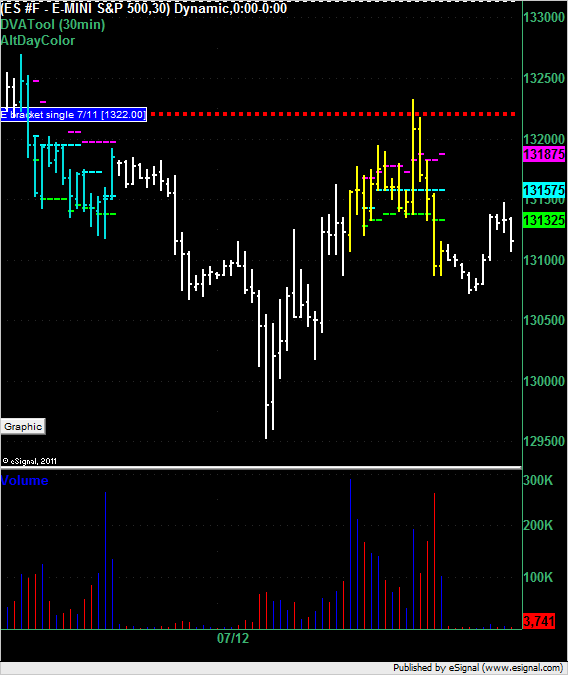
Just a single print recap from today. The single print left on the chart at 1322 even yesterday would have suffered a 1.25 point draw down if used as a short entry location.
Emini Day Trading /
Daily Notes /
Forecast /
Economic Events /
Search /
Terms and Conditions /
Disclaimer /
Books /
Online Books /
Site Map /
Contact /
Privacy Policy /
Links /
About /
Day Trading Forum /
Investment Calculators /
Pivot Point Calculator /
Market Profile Generator /
Fibonacci Calculator /
Mailing List /
Advertise Here /
Articles /
Financial Terms /
Brokers /
Software /
Holidays /
Stock Split Calendar /
Mortgage Calculator /
Donate
Copyright © 2004-2023, MyPivots. All rights reserved.
Copyright © 2004-2023, MyPivots. All rights reserved.


