ES Big Pic View for Friday
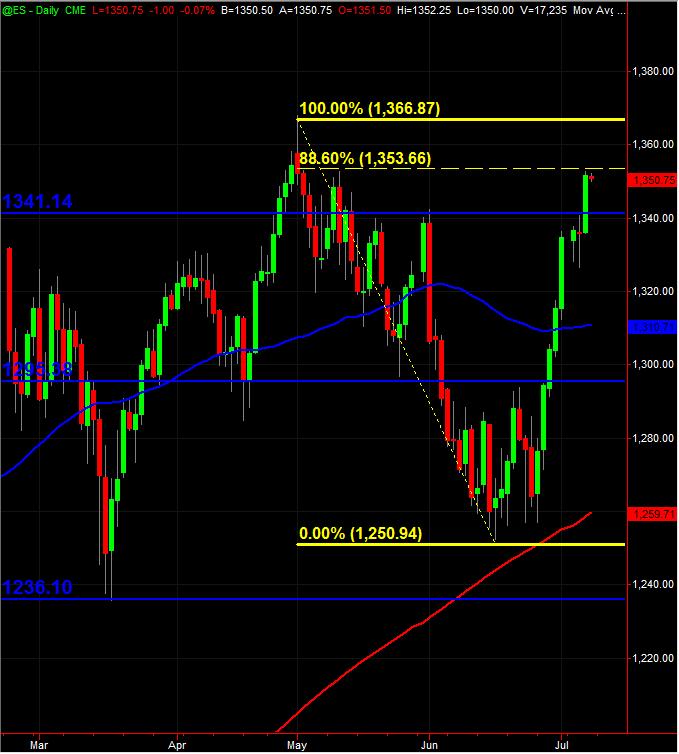
Here's my Daily ES continuous contract chart (All Trading Hours) with the Fib Retracement of 88.6 using TS. Jim Kane probably has this in his forum ... but thought I'd post it here. Maybe Jimbo, you could add to this and describe how valid or not it may be along with other factors that should be considered.
For anyone else, this is a topic to post YOUR BIG PIC view of the ES.
Obviously the (un)employment report can always create funky chaos. This ain't intended to be the ES intraday trading thread, but rather something we can all dog pile in on with each of our different big pic postings of charts to potentially incorporate into Friday's trading session.
MM
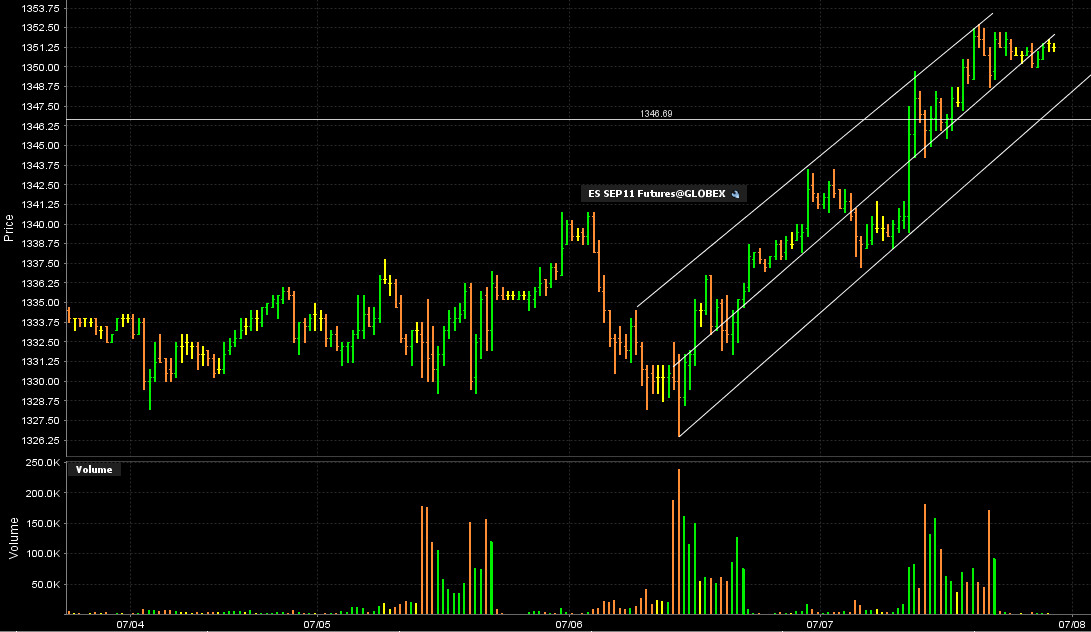
I call this the super delux , great in hindsight channel....laugh as I might it actually helped me pull the trigger to get the second set of single prints today....Most know I trade for those....we'll see how this plays out from here..
I've marked this daily chart with three arrows. They mark the important daily resistance reference points. Yesterday busted through the 6-1 mark of 1342.75 but it found resistance on the 5-11 mark of 1352.75.
This morning prices traded up and through that mark but are now back below waiting for the big numbers out at 8:30.
This morning prices traded up and through that mark but are now back below waiting for the big numbers out at 8:30.
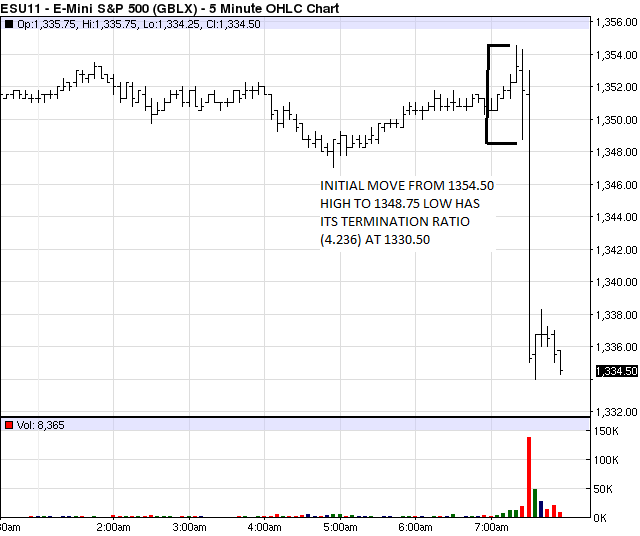
Jun non farm payrolls up ONLY 18K
wow
wow
LOL...gap closed...
Yep Lorn they closed it - HAHA
with yesterday's GAP UP,
If the RTH today Opens gap down
then the market will have created an island top.
maybe I should just say an "island"
Lorn or Bruce, you guys run the weekly Volume at price, is there a bulge for this week in the 1335.50 to 1333.00 area?
If the RTH today Opens gap down
then the market will have created an island top.
maybe I should just say an "island"
Lorn or Bruce, you guys run the weekly Volume at price, is there a bulge for this week in the 1335.50 to 1333.00 area?
For those that are not familiar. MonkeyMeat chart showing 88.6 retrace. The rule states we go all the way back to the bottom.
Yes Paul, 1334.50 is the weekly VPOC and its pretty much solid volume between 1335-1330.
Originally posted by PAUL9
Lorn or Bruce, you guys run the weekly Volume at price, is there a bulge for this week in the 1335.50 to 1333.00 area?
thanks kool
I was hoping you'd post.
I was hoping you'd post.
Sorry, meant from 1257 fib for levels
Emini Day Trading /
Daily Notes /
Forecast /
Economic Events /
Search /
Terms and Conditions /
Disclaimer /
Books /
Online Books /
Site Map /
Contact /
Privacy Policy /
Links /
About /
Day Trading Forum /
Investment Calculators /
Pivot Point Calculator /
Market Profile Generator /
Fibonacci Calculator /
Mailing List /
Advertise Here /
Articles /
Financial Terms /
Brokers /
Software /
Holidays /
Stock Split Calendar /
Mortgage Calculator /
Donate
Copyright © 2004-2023, MyPivots. All rights reserved.
Copyright © 2004-2023, MyPivots. All rights reserved.


