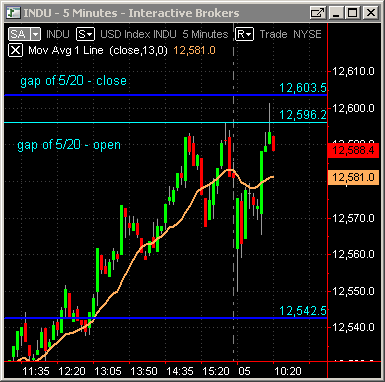
ES 7-5-2011
Reference Numbers to start the week.
Weekly Close 1335.25 (4:15)
Weekly H/L 1336.5/1257 or 1336.5/1261.75 (RTH)
1339.00 Gap from 6-1
Single Prints 1330 and 1317.25
Currently the O/N MP Profile is showing a three TPO selling tail. Volume is above average so far so it should be interesting to see how RTH handles things.
Weekly Close 1335.25 (4:15)
Weekly H/L 1336.5/1257 or 1336.5/1261.75 (RTH)
1339.00 Gap from 6-1
Single Prints 1330 and 1317.25
Currently the O/N MP Profile is showing a three TPO selling tail. Volume is above average so far so it should be interesting to see how RTH handles things.
My mistake....its a four TPO selling tail from 37.75 to 37.
Originally posted by Lorn
Currently the O/N MP Profile is showing a three TPO selling tail. Volume is above average so far so it should be interesting to see how RTH handles things.
reminder - report at 10. After 5 days up if the report is not "perfect", traders would take profit
60 Min lows come smack on that 1330 single print so its supportive nature is larger then normal. Also, the 60 min high came right on 1335.25 which is Friday gap close. All in all, pretty balanced trade so far rotating from low to high, back down to low. MATD?
Another interesting observation is while ES opened below Friday's close the NQ opened above its Friday close. So prices rotated up for ES to fill its gap then everything rotated down and NQ filled its gap. Pretty nifty. Volume is pathetic since the open, this is gonna meander back and forth without much conviction until something changes...
I'll be watching NQ for any early signs of breaking either side of the mornings trade.
I'll be watching NQ for any early signs of breaking either side of the mornings trade.
and a beautiful gap at 34.25 with failure outside the 60 minute lows...
No gaps on my chart, Bruce.
data gap lisa at 34.25....intraday !!
Feng, I did a thread on one minute volume spikes. I think Lorn covered all the key points though in his reply. I always look to see if we can get big $ticks on push outs of key ranges also to see if prolonged lower or higher readings prevail. Today we had higher lows in the $tick when we broke that hour low. That helps with the entry.
I began a research project about two months ago with the footprint charts that I look at after the market closes to help refine entries but so far that has been a worthless pursuit. I can't find an edge with that. As you know I add to trades so there is an element of "Gut feel" to some of this. My Market delta software has some cool volume with time functions that I have been messing with. To help show momentum or the lack of momentum.
For now I just take the trade as long as it is in proper context. I'm unafraid to add. Trust me when I tell you that I am working hard to remove the discretionary elements of my trading. Posting ideas to the forum helps me realize how hard it would be to "teach" certain elements of trading as I know it.
Many times you will not get that great mean reversion trade but often you will get the retest back to the 60 and 90 minute highs or lows after they break it out. I will add to trades expecting retest back. So often I am wrong on the first part of the campaign. hope that helps.
Emini Day Trading /
Daily Notes /
Forecast /
Economic Events /
Search /
Terms and Conditions /
Disclaimer /
Books /
Online Books /
Site Map /
Contact /
Privacy Policy /
Links /
About /
Day Trading Forum /
Investment Calculators /
Pivot Point Calculator /
Market Profile Generator /
Fibonacci Calculator /
Mailing List /
Advertise Here /
Articles /
Financial Terms /
Brokers /
Software /
Holidays /
Stock Split Calendar /
Mortgage Calculator /
Donate
Copyright © 2004-2023, MyPivots. All rights reserved.
Copyright © 2004-2023, MyPivots. All rights reserved.


