ES Thurs 06-23-11
Rare indeed double islands. Islands by themselves are rare and rarely last for long, but right now this, a double island set is something else.
for today, Thurs 6-23-11, if price opens in a gap below 75.75, then the market has created double islands one above and below.
The gap that remains open for both is 75.75 to 77.50 (and I would expect it to be filled sometime today)
price is testing 50% of the prior week's range (1269.75), this is a likely bounce zone, (short-term intraday) but can easily be retested RTH. if there is a lift from the current 50% of last week's range, and then a retracement (would prefer to see retracement undercut whatever L is established now by 1 tick), the pattern I look for is a 1-2-3 buy (AFter some sort of a lift and retracement.)
this might be my only comment of the day
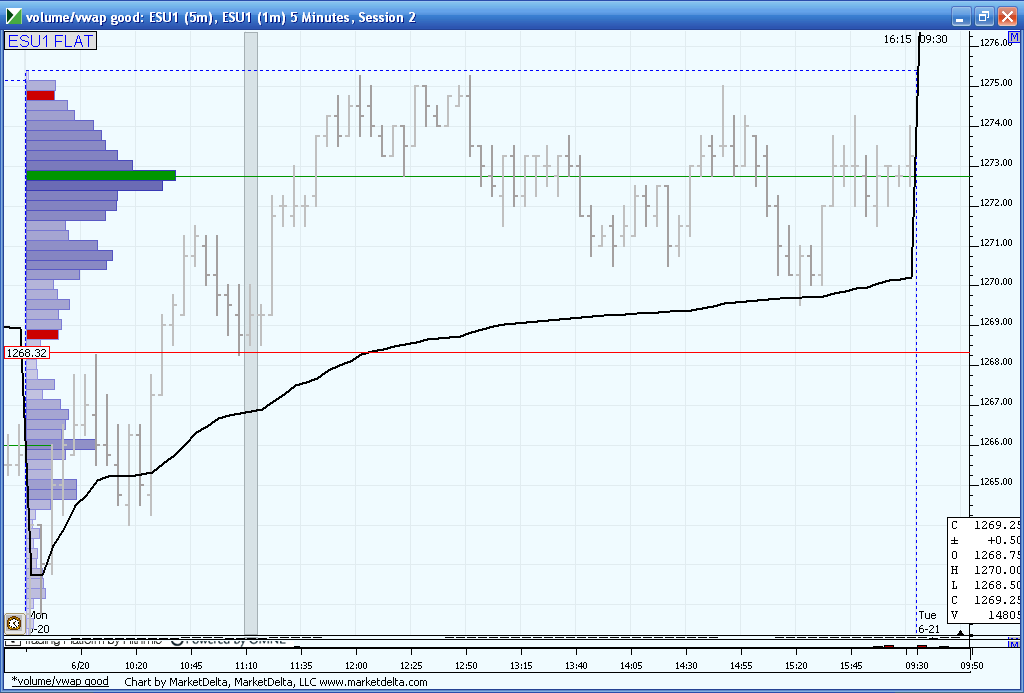
this may be a stretch for some to see but it is the volume profile from 6 - 20. This created the "P" profile and you can see the BELL curve that is bounded by the 68.50 area on the low side and the 75 area on the high side with the 72.75 area as the peak volume price. So that is why I am watching those numbers carefully...I was expecting the lower boundaries to be tested which hasn't happened yet. I think if we can hold back any drop below 55.75 then we still have a chance to go back to 68 and higher
Originally posted by BruceM
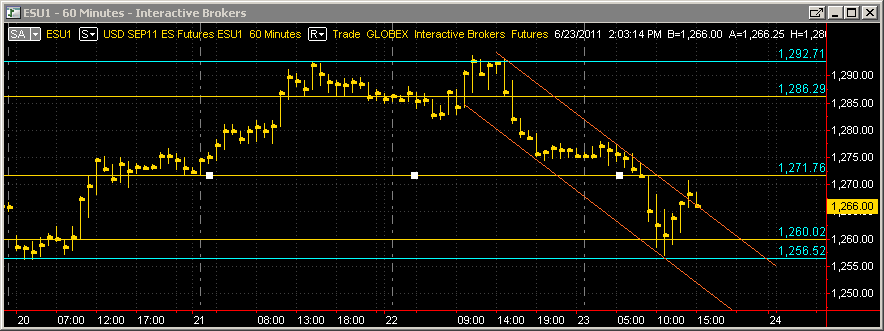
three key resitance areas...69.50 , 72.50 and 75.50....
thanks for the chart. I can actually see it (due to light colored background on the chart)
bruce, thanks for the chart
what would you recommend as a good read to someone who knows just the basics of market profile trading but wants to take it to the next level?
thanks
what would you recommend as a good read to someone who knows just the basics of market profile trading but wants to take it to the next level?
thanks
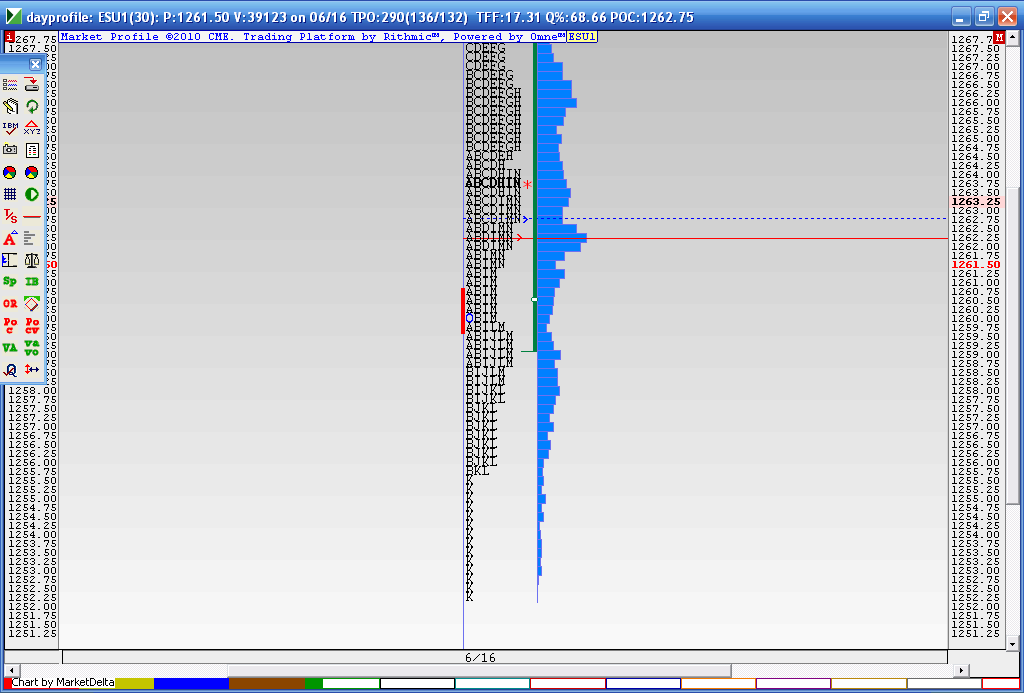
this is what all the traditional MP players are watching down here...this buying tail in the "K" period from 6-16. That was 3.25 points of buying that rallied the market up...also look at the "M" period....Dalton would call that an anomoly...that was also what I was looking at in conjunction with the pitull minus 8 number trade today...
Have u read both of Daltons books and read through his free articles on his site? that would be the best place...
i haven't, but will look into it
thanks again
thanks again
The volume POC is creeping up...it jumped from 61 up 63..so in theroy volume is being created at higher prices...not lower....when we get failures outside the hour range we can target the middle and if the middle gets accepted then they will go to the opposite side...so I still think we have the potential to get the run up.....
sorry if this is a dumb question but when targetting the middle, is it the middle of the ib or the middle of the expanded range after the break ?
WTF was that?
wasn't here for the second set of triples but congrats to those who got lucky on that long rocket....a perfect run of both sets of triples today
Emini Day Trading /
Daily Notes /
Forecast /
Economic Events /
Search /
Terms and Conditions /
Disclaimer /
Books /
Online Books /
Site Map /
Contact /
Privacy Policy /
Links /
About /
Day Trading Forum /
Investment Calculators /
Pivot Point Calculator /
Market Profile Generator /
Fibonacci Calculator /
Mailing List /
Advertise Here /
Articles /
Financial Terms /
Brokers /
Software /
Holidays /
Stock Split Calendar /
Mortgage Calculator /
Donate
Copyright © 2004-2023, MyPivots. All rights reserved.
Copyright © 2004-2023, MyPivots. All rights reserved.


