ES Day Trading 5-31-2011
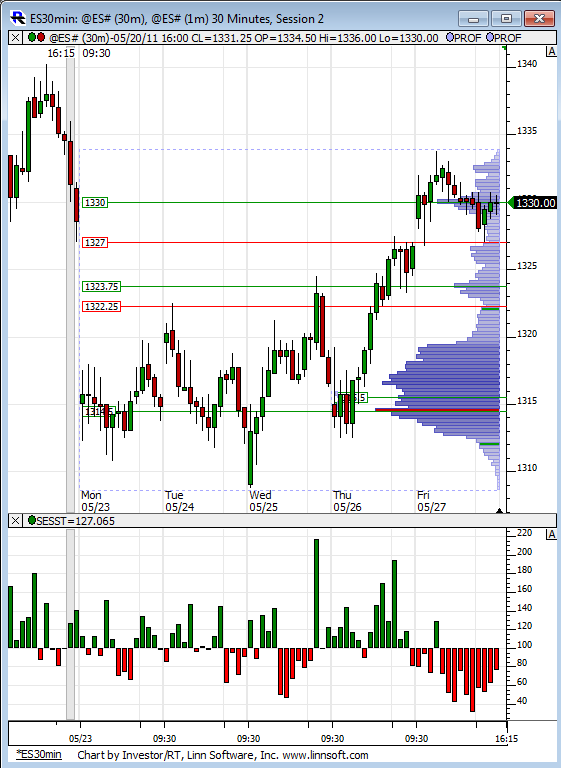
Getting thing started with a look at last weeks volume profile. Obviously prices are much higher here in the O/N but one of the interesting things to note on this chart is the expanding volume on up moves and decreasing volume on pullbacks. Classic behavior in an up trending market.
Big Traders would bounce from here 1337.00 since it's a fib 50% solid are with high volume.
I am counting the fib's number from ON's 30.00 to 44.00 movements. If you consider from afternoon low of friday to ON's high you should get fib's 50% 1335.50-1336.00 that would be a good place to go long I belive for a scalp of 2 points.
John, r u saying the big traders trade fibs or the big traders use 50 % ? my vote is for the 50 % but that isn't a true fib or so I am told.....interested in your opinion...
speaking of volume spikes Lorn....this is where the O/N volume spike happened..biggest one happened staring at 37.50 price so that area had to become part of our key areas mentioned on page one
speaking of volume spikes Lorn....this is where the O/N volume spike happened..biggest one happened staring at 37.50 price so that area had to become part of our key areas mentioned on page one
so far we have a selling tail, we are below the open and O/N peak volume and we are EXPECTING The high to low day.....liking the "go with the selling trend " so far....not the best environment for long trades IMHO
Long here from 1336.00
Yes you are right. Big O/N volume zone here.
Originally posted by BruceM
speaking of volume spikes Lorn....this is where the O/N volume spike happened..biggest one happened staring at 37.50 price so that area had to become part of our key areas mentioned on page one
I would take out half position on 1338.00 and run the rest to 1340.00.
that is one ugly looking RTH low so far.....look at all those stops....it shows no real buying impulse...nobody in a rush to get long yet...expecting that to get run.....
I started selling into 38...the reason is that this entire area...35.75 - 37.50 is shaping up into it's own miniature bell curve and I noticed volume was drying up as we went higher..36.75 is peak volume so that is the line that bears need to push through to get those lows run out.....
I will add above 39.50 if needed but not gonna get too crazy today
I will add above 39.50 if needed but not gonna get too crazy today
I deserve that! Foot still in mouth. BTW... the function works Great! Wouldn't of wanted to miss this post... no really!
Originally posted by Dubya
This is a good option to have..hopefully it will still remain "calm" TQ......
Emini Day Trading /
Daily Notes /
Forecast /
Economic Events /
Search /
Terms and Conditions /
Disclaimer /
Books /
Online Books /
Site Map /
Contact /
Privacy Policy /
Links /
About /
Day Trading Forum /
Investment Calculators /
Pivot Point Calculator /
Market Profile Generator /
Fibonacci Calculator /
Mailing List /
Advertise Here /
Articles /
Financial Terms /
Brokers /
Software /
Holidays /
Stock Split Calendar /
Mortgage Calculator /
Donate
Copyright © 2004-2023, MyPivots. All rights reserved.
Copyright © 2004-2023, MyPivots. All rights reserved.

