ES day trading for 5-27-11
First resitance line is at current O/N high as we approach the 8:30 reports...so
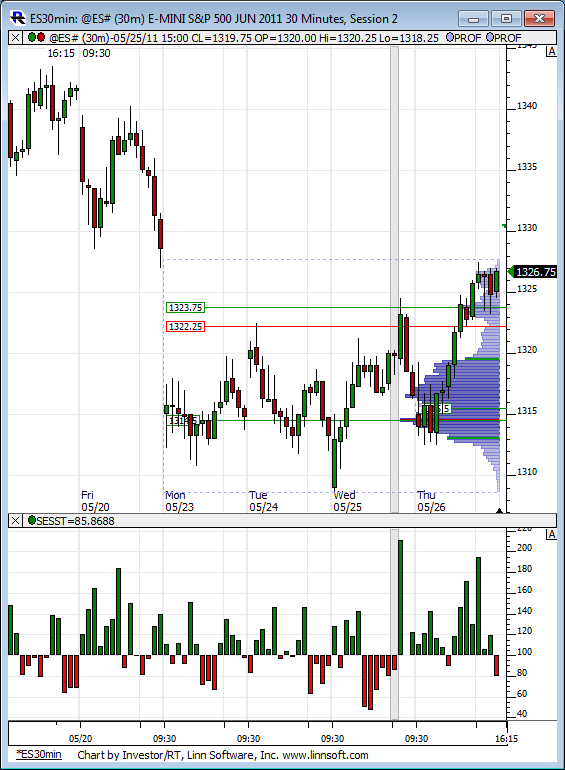
1330.50 - this is also last fridays VA low !
then above there we run into a high and low volume combination from last friday up at
1332.50 - 1335 *******that is a better zone I think for selling against if given the opportunity
\
On the downside we have that key area from YD at 23.75 and the current O/N low is 24.40 so key support will be
1323.75 - 1324.50 ***
under there is a low volume area at 19.50 - 21.25...the breakout zone...that is important to bulls so it gets lots of stars ********
those two zones are tight.....
These will be revised after reports hit....
3 day weekend and reports also at 9:45 and 10 a.m.
I'm hoping to get trading over with fast today......It's one thing having losses but having them infront of a long weekend is worse for me...so overall I will be trading lighter and not as agressive
I favor the short side again.
as usualy we will watch the ranges to see what holds and what fails....
I am totally leary of any day ahead of a long weekend.
somebody's drawing a line on the chart 1330-1331 area.
PP generated by last week's RTH only PA is 1330,
50% of last week's range is 1330.75 (prices based on RTH only).
If price probe a tick or two above these levels longs wanting to hold profits in stead of inventory over a long weekend might start liquidating.
regardless of whether there is another attempt to print above current overnight Highs, the mid point of the AH would be the break point for me and a move down to test the breakout point of 1323.50 (H established 4am 5-26-11) would be expected if mid point of AH does not act like support (sort of expect it to break)
I would be watching the NQ. If it is not mimicking or showing greater strength than the ES, upside is a bigger gamble than usual.
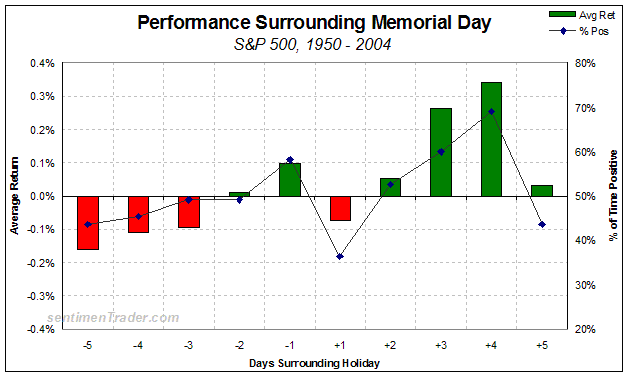
I don't remember what the seasonal stack is for last trade day before the memorial day weekend, But with thinly traded markets on a day before a 3-day weekend, gambling is bigger part of trading on the day, it will take less like minded people to push prices higher -or- lower
10am pending home sales might be a headline creating a response.
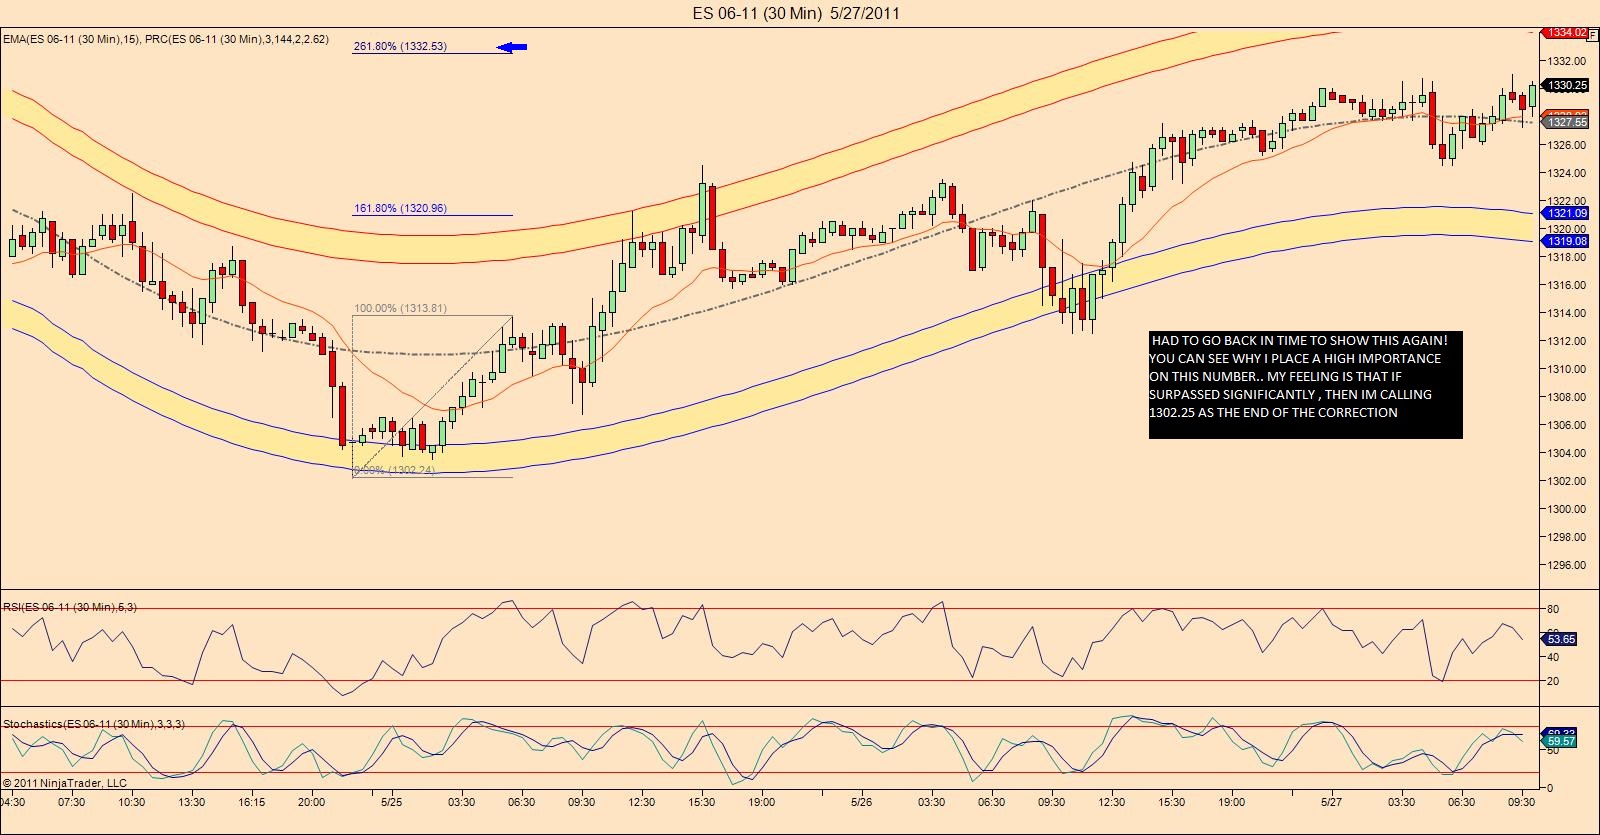
Hope this helps....today of course is -1 I will be selling the price projection from the 1302.25 low to 1313.75 initial move with its 2.618 at 1332.25-50....
it's good that they haven't printed YD highs in RTH yet...I'm planning on them coming back down for that.....better for fades
Big volume spike on that break of the O/N high. Pre-news. Maybe someone knows the numbers in advance.
Originally posted by Lorn
Big volume spike on that break of the O/N high. Pre-news. Maybe someone knows the numbers in advance.
I used to try and read the minds of insiders like that. There is also the theory that they are pushing it up in order to get a higher fill to slam it down when the bad news comes out.
The conclusion I came to is screw news! Stick to what the chart is telling me. ;]
Originally posted by neoikon
The conclusion I came to is screw news! Stick to what the chart is telling me. ;]
That being said... news beat estimates. ;]
Pending Home Sales in 5min.
.
Wow, pending home sales down -11.6%
From John Mauldin.... http://pipesandtheories.blogspot.com/2011/04/keynes-v-hayek-rap-battle-part-ii.html
Emini Day Trading /
Daily Notes /
Forecast /
Economic Events /
Search /
Terms and Conditions /
Disclaimer /
Books /
Online Books /
Site Map /
Contact /
Privacy Policy /
Links /
About /
Day Trading Forum /
Investment Calculators /
Pivot Point Calculator /
Market Profile Generator /
Fibonacci Calculator /
Mailing List /
Advertise Here /
Articles /
Financial Terms /
Brokers /
Software /
Holidays /
Stock Split Calendar /
Mortgage Calculator /
Donate
Copyright © 2004-2023, MyPivots. All rights reserved.
Copyright © 2004-2023, MyPivots. All rights reserved.


