ES Day Trading 5-26-2011
im lowering my stop to 1319.00 for now
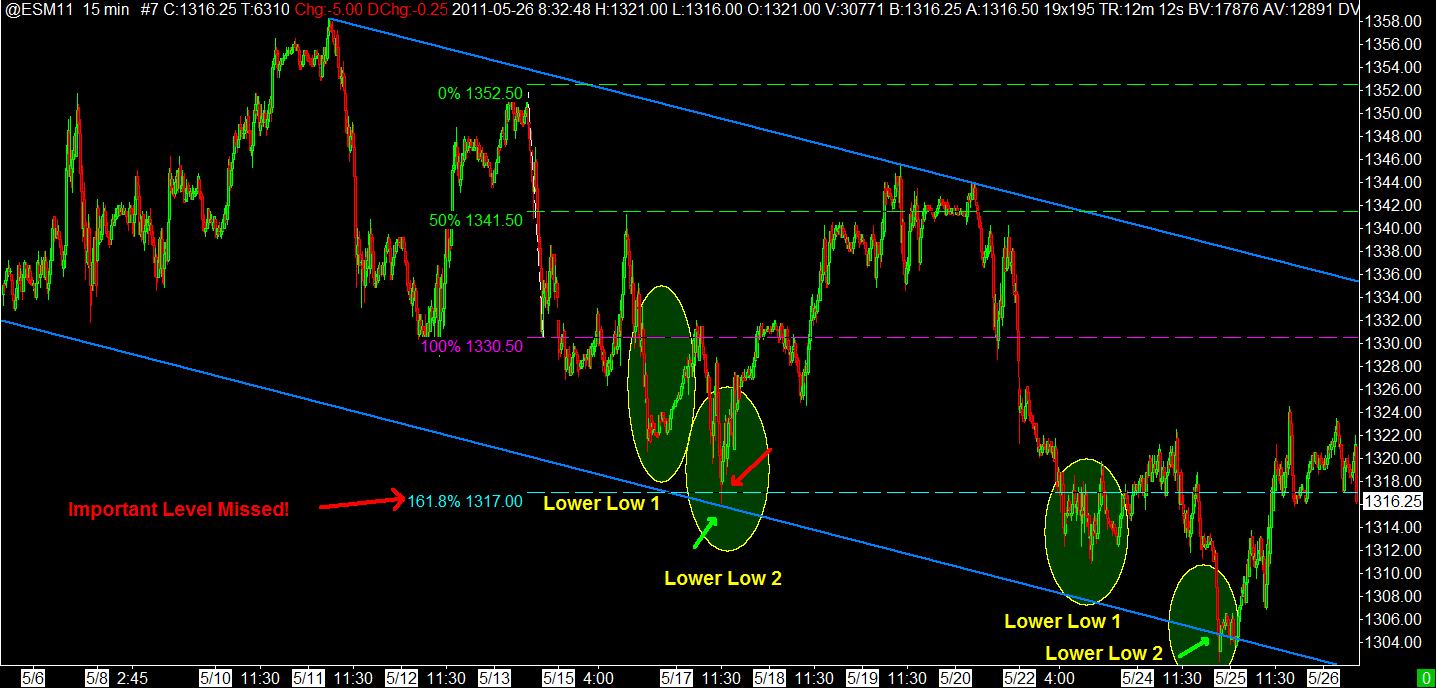
I find Fibonacci so amazing. I use this tool that takes two levels, then calculates many 0.618 levels (fractaling inward).
In this case, I am using 665.75 and 1552. And somehow calculated levels down to intraday give meaningful areas, given such a large range.
The calculated levels are "grouped", as you can see in the image, we are battling between two "Intermediate" points.

In this case, I am using 665.75 and 1552. And somehow calculated levels down to intraday give meaningful areas, given such a large range.
The calculated levels are "grouped", as you can see in the image, we are battling between two "Intermediate" points.

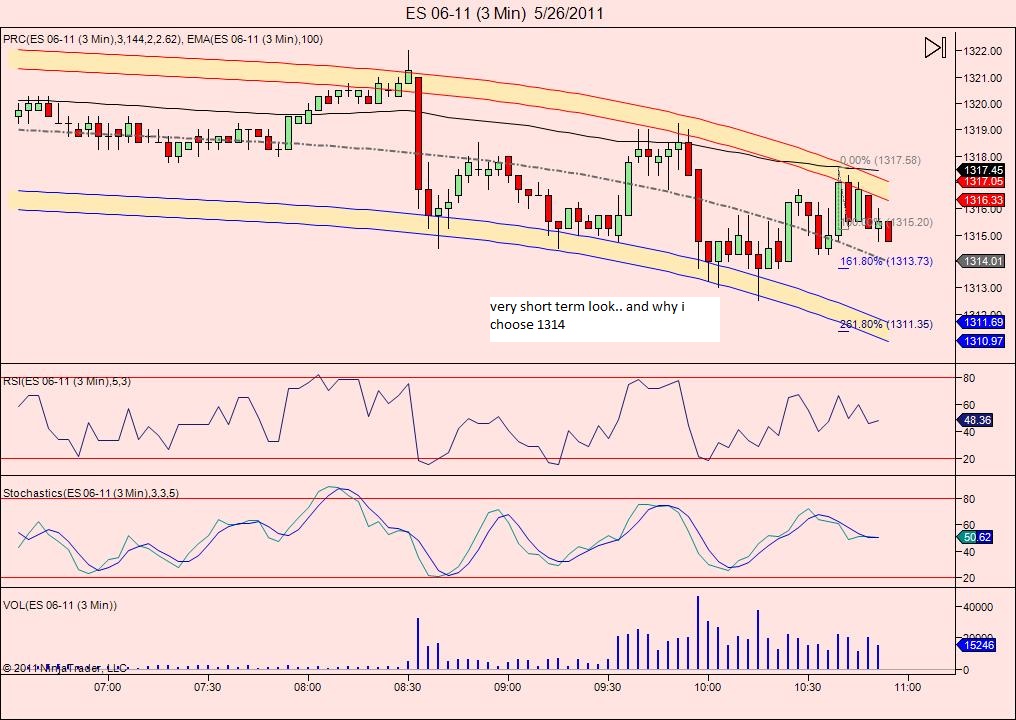
covering 1314.00 if it prints as this could take a while and i want to swing to the euro...
Bingo! ...nice scalp....
This morning was the MATD concept. For me this is usually a day that follows a day that had very little time spent near the open print on the 30 minute bars. So it is a day following what is percieved as a trend day.
Yesterday had only the first 30 minute bar with the open print...no other bars were able to get back to the open. So the day following those sets up the classic fades.......these days we must try to buy strength or sell weakness with the assumption that we will eventually return to the open print at some time. The first trade is usually the best and I wouldn't get too greedy with this concept.
I think there are many traders who make their living expecting two sided trade at the open print. So the trend days are more challenging and those traders get cheated and need to work harder. I partially fall into this category and anyone who read the threads yesterday saw the challenge I faced. The point being is that we can do well knowing what usually happens following trend days.
Those who doubt the concept should just bring up some 30 minute bars in RTH and see how often we return to the open after the first 30 minute bar is completed on the same day. I'm sure someone can back test the concept.
This market seems to be setting up for just a huge consolidation with the 1315 - 1316.50 in the middle.....the obvious extremes are the weekly low and high at the 1324 area and the 1309 area...
no surprise where the middle of those extremes falls..
This is the same LOW volume area I had marked off yesterday....so today they are filling that in to round out the bell curve even more.
This will eventually lead to a breakout...so we can't just keep buying and selling blindly...you'll get smoked when the true breakout comes.
So take a look at LORNs chart on page 1 for those who don't have the ability to merge volume...classic bell curve...we need to monitor volume near the extremes to determine if we should stop fading the extremes. The market should soon search for new volume especially since we have rounded out the formation.
Originally posted by BruceM
This morning was the MATD concept...
I love this kind of stuff! I always try to go in with a plan on what to expect in the mornings, so having something like this in your back pocket is very useful.
Thanks! Keep them coming!
Daniel
I believe the market wants to be in green. I would put my long position on avg 1315.25
Nice scalp to 1317.25. Leaving to lunch
Originally posted by johnpr2010
I believe the market wants to be in green. I would put my long position on avg 1315.25
sold small above gap in data...22even...air below...may be early again..
No Problem......
Methodlogies tend to be frameworks and understanding the lack of of tech at the time he probably used his thumb to guesstimate the 10 day moving average......oversimplfying I'm sure.
If you look at the chart.....does it look wrong? Or does it look very very right......it looks like that every day. This morning they were just backing up truck @1312-14 level.
His base method is very accurate....even some decades later....its works on everything I've pointed it at.....
Understanding the cycle is not crtical as each day is new.....but cycle position can increase probability of the event outcome.....if you review this week you'll see a cycle low with a
1. 2.618 long Night +11 then
2. 1.618 long Morn +18 then
3. 1 long then +15
4. tomorrow......we'll see right?....down cycle could begin again....but if you short a stretch failure you'll catch the big drop.
Emini Day Trading /
Daily Notes /
Forecast /
Economic Events /
Search /
Terms and Conditions /
Disclaimer /
Books /
Online Books /
Site Map /
Contact /
Privacy Policy /
Links /
About /
Day Trading Forum /
Investment Calculators /
Pivot Point Calculator /
Market Profile Generator /
Fibonacci Calculator /
Mailing List /
Advertise Here /
Articles /
Financial Terms /
Brokers /
Software /
Holidays /
Stock Split Calendar /
Mortgage Calculator /
Donate
Copyright © 2004-2023, MyPivots. All rights reserved.
Copyright © 2004-2023, MyPivots. All rights reserved.

