ES Day Trading 5-23-2011
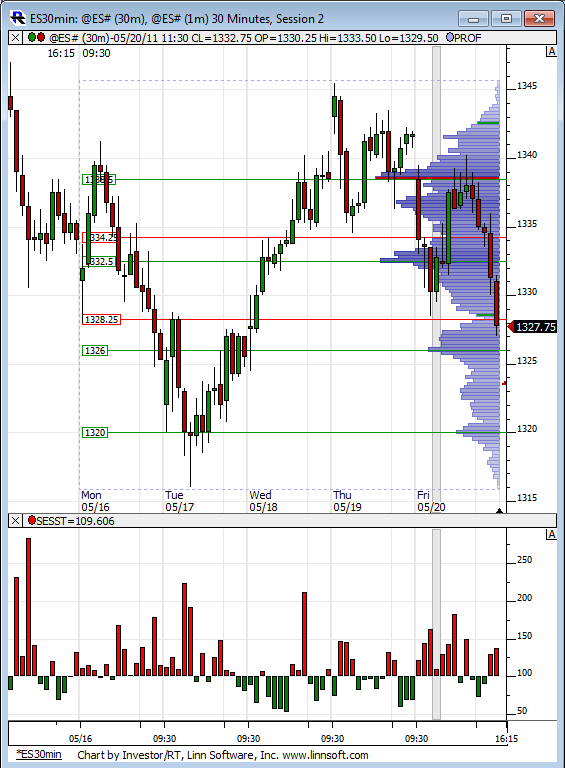
Volume Profile for last weeks RTH action. Not much volume relatively speaking at the bottom of the range.
Hi, Bruce
Sure, I'll bite.
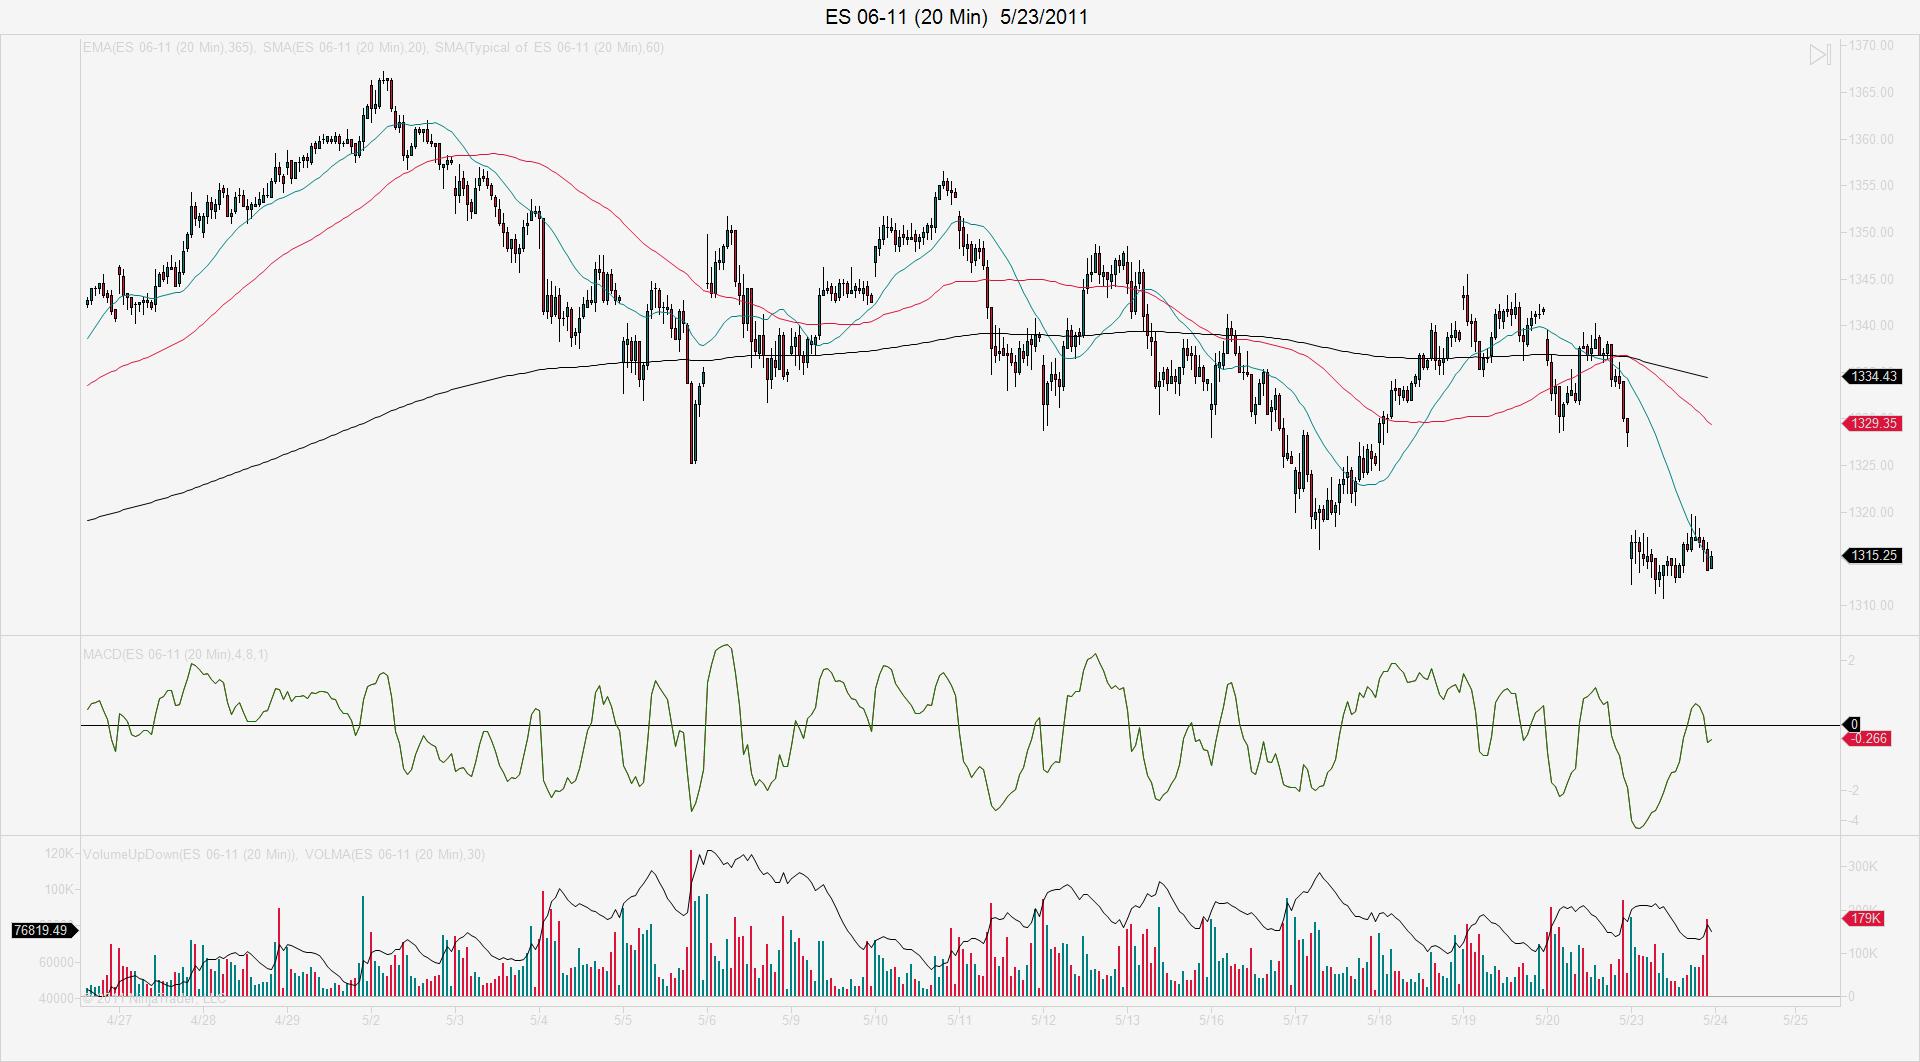
I follow a chain of MA's in varying time-frames with numbers manipulated to coincide with daily numbers. The equivalent of a 3 day typical MA, in my 20 chart, assumed by the equivalent of the 1 day MA. I noticed it first in a series longs to retest. MA crossovers, &ct., but the way I have my charts you can see if prices are rejecting by not hitting the .25%'s. in consolidating periods. And if they do, I stay the position until lower MA's ride above the 55 for a spell. Then the mini-capitulation.
21 printed as market satisfaction. I noted it.
Chop and all, to the tick, we may not get there, so don't bust my chops. ;^>
Originally posted by BruceM
we are watching...just busting on ya but if you want to give us a reason why you thought that would print then that would be helpfulOriginally posted by ramiegram
21 PRINT!
Watch
thanks....we closed one tic off the midpoint.....neutral days..!
Emini Day Trading /
Daily Notes /
Forecast /
Economic Events /
Search /
Terms and Conditions /
Disclaimer /
Books /
Online Books /
Site Map /
Contact /
Privacy Policy /
Links /
About /
Day Trading Forum /
Investment Calculators /
Pivot Point Calculator /
Market Profile Generator /
Fibonacci Calculator /
Mailing List /
Advertise Here /
Articles /
Financial Terms /
Brokers /
Software /
Holidays /
Stock Split Calendar /
Mortgage Calculator /
Donate
Copyright © 2004-2023, MyPivots. All rights reserved.
Copyright © 2004-2023, MyPivots. All rights reserved.

