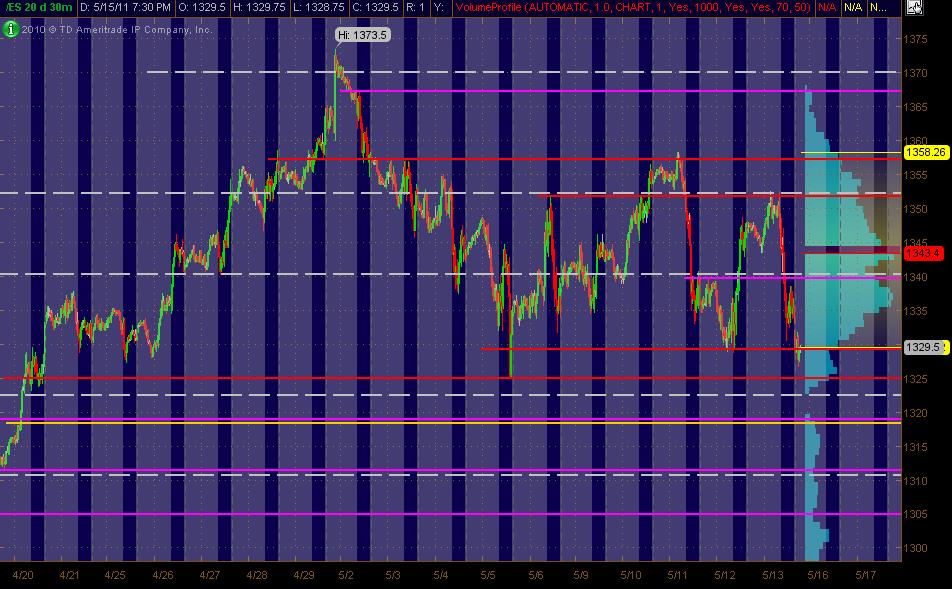
ES S/R Monkey Map for 5-16-11
Here's my 30min MAP of 20 trading days that I've got with the Red lines as potential significant PASR levels with Magenta as semi-significant. The White dashed lines are Weekly Pivots. I've also got a Yellow line in the 1318-19 zone that's a Fib Cluster, fwiw. The Gray background is "overnight trading" and the Light Blue bars on the right vertical axis represent Volume at Price. Hope this is helpful to some folks!
ES Volume Profile Charts:
Top Left: 5min chart of 2 days data ATH
Top Right: 5min chart of 2 days data RTH
Bottom Left: 5min chart of 1 days data ATH
Bottom Right: 30min chart of 2 days data ATH
Top Left: 5min chart of 2 days data ATH
Top Right: 5min chart of 2 days data RTH
Bottom Left: 5min chart of 1 days data ATH
Bottom Right: 30min chart of 2 days data ATH
Thanks MonkeyMeat! Good morning all.
FYI, 52.8% between PP and S1 is 1332.50, which is the area we've seen resistance a couple times O/N. I'm expecting it to break at some point for the gap fill to happen and watching res at 1335.50, IMHO.
Best of luck to all,
Daniel
FYI, 52.8% between PP and S1 is 1332.50, which is the area we've seen resistance a couple times O/N. I'm expecting it to break at some point for the gap fill to happen and watching res at 1335.50, IMHO.
Best of luck to all,
Daniel
Looking at 36.25 for a scalp short, based on 10 point reversal from O/N lows.
Originally posted by TravelinTrader
Looking at 36.25 for a scalp short, based on 10 point reversal from O/N lows.
0.786 from S1 to PP is also 1336-1336.25, I have a higher fib at 1336, top of my VA at 1335.50, daily gap fill at 1335.25... all around that same area, TT.
Plus, BANK gapped 7-8 points, which I've found is a sweet spot to look for res/sup on the ES's gap fill.
Looks like all the news missed this morning.
Plus, BANK gapped 7-8 points, which I've found is a sweet spot to look for res/sup on the ES's gap fill.
Not sure I understand this. Can you please elaborate. Thanks
short at 33.75
oopss misprint shorted at 35.75
Originally posted by TravelinTrader
Plus, BANK gapped 7-8 points, which I've found is a sweet spot to look for res/sup on the ES's gap fill.
Not sure I understand this. Can you please elaborate. Thanks
Sure. I find the banking index ($BANK) to be a leader. So, I take note of the size of its gap. Today $BANK gapped down 7.69 points (opened 7.69 points down from its close on Friday).
One of the things I look for is the ES to fill its daily gap (4:00pm EST close), today it's at 1335.25. If it does fill its gap, there is a chance there will be resistance at the gap fill level (or it may just pass right through). To help me gauge if I think the ES will find resistance at its gap fill or not, I like $BANK to have a gap size of about 6-10 points (and to fill around the same time as the ES).
Of course, everything looks good for there to be resistance at 1335-36, yet we still popped up to 37. So, we'll see.
Generally, my target is back to the open. However, BANK has passed through its gap fill and is looking strong, so I would be more cautious.
Daniel
Ok Neo, I get it, thanks for the explanation, it's kinda what I thought you meant. I agree with the gap fill theory, but now I will look at $bank to help confirm that move.
Originally posted by BruceM
hopefully u saw all the triples today TOO !!
You got to be kidding me! I was looking for'em. How'd I miss THAT! Right at the RTH open! You got me!
Emini Day Trading /
Daily Notes /
Forecast /
Economic Events /
Search /
Terms and Conditions /
Disclaimer /
Books /
Online Books /
Site Map /
Contact /
Privacy Policy /
Links /
About /
Day Trading Forum /
Investment Calculators /
Pivot Point Calculator /
Market Profile Generator /
Fibonacci Calculator /
Mailing List /
Advertise Here /
Articles /
Financial Terms /
Brokers /
Software /
Holidays /
Stock Split Calendar /
Mortgage Calculator /
Donate
Copyright © 2004-2023, MyPivots. All rights reserved.
Copyright © 2004-2023, MyPivots. All rights reserved.

