ES update
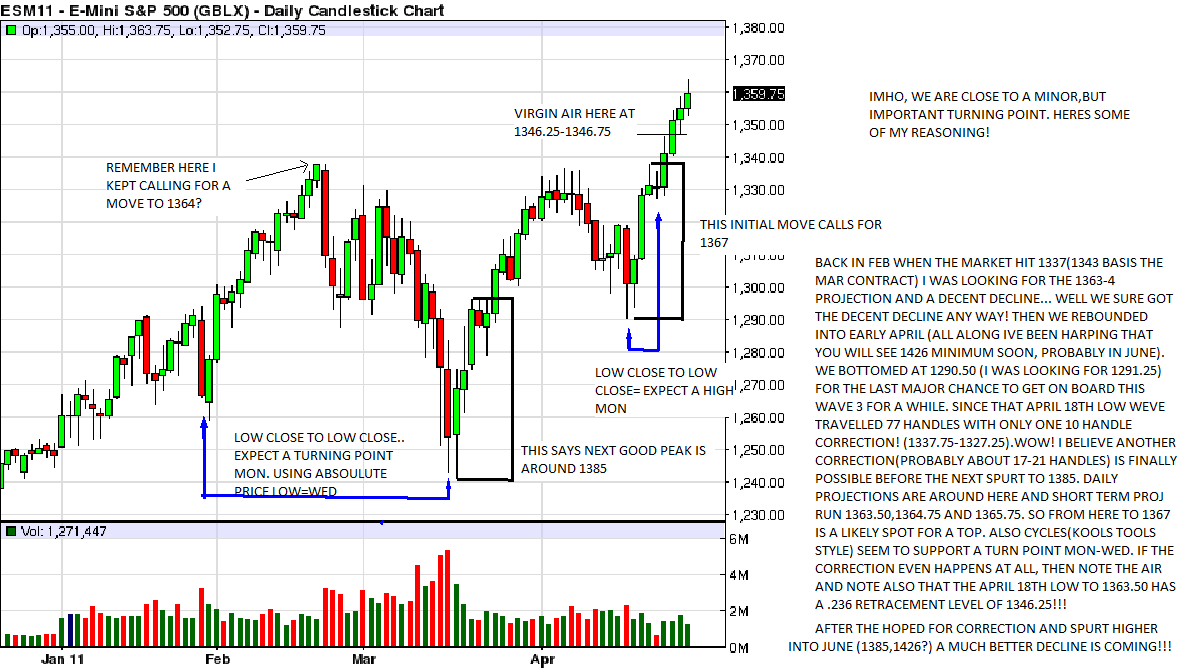
I'm still concentrating mostly on the euro as i slowly make the transition to increasing my position size, but am starting to watch the ES as i feel an inflection point (tho minor in the larger scheme of things) is imminent. Friday i had a ten lot sale ready to pop at 1361.25 and we touched 1361.00 before going to my objective! sheese!.. Anyway, here's a look at what may occur next week(then again, maybe we just continue on to dow 36,000!lol)
...seasonals seem to support my hypothesis...
..Good luck gang!
...seasonals seem to support my hypothesis...
..Good luck gang!
Yes, reading!
Originally posted by Lisa P
I anyone here to read posts?
I Read! A lot! I just shouldn't start typing yet.
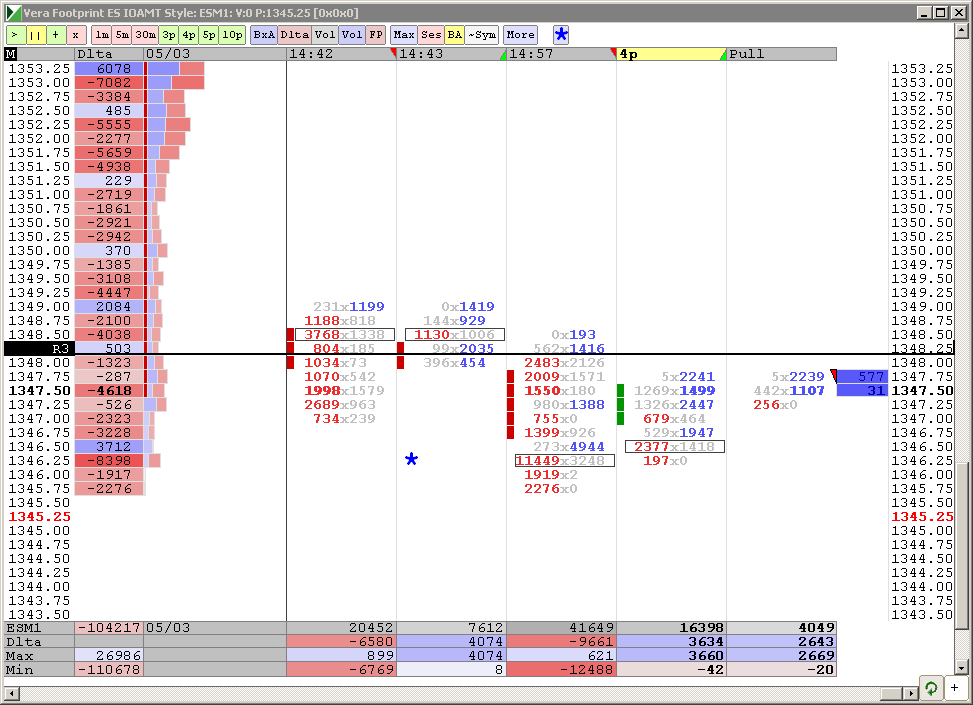
I have 1350 and 1355.75 as significant levels
I missed typed my thinking ,46.75 was a target not projected low of the day
1350 hit - that is where last bears came in. Thinking of shorting, but NQ strong - watching
Last time bears shorted at 1350, see new bears coming on my M-Delta. If they cannot make money - all will cover fast and furious
here's something I picked up from the gap guy.
600 period exponential moving average (RTH only on 5min bars) is important because it attracts multiple attentions.
for traders who use 15 minute charts, the 600XMA on the 5min is equivalent to 200 period moving average.
for traders who use 30min chart, it is eqivalent to 100xma
first test from above (happened today, 600 xma on 5m = 1347.50 right now) usually produces a bounce (that's my observation from looking at historical charts),
BUT, (here's the Gap Guy's observation I think he mentioned he heard it from Marc Chaikin) if price ends today ABOVE the 600xma But Opens tomorrow's RTH with a gap BELOW the 600xma, those gaps have high odds of not filling in the day.
Originally posted by Lisa P
Last time bears shorted at 1350, see new bears coming on my M-Delta. If they cannot make money - all will cover fast and furious
Nice cover to VWAP
Originally posted by koolblue
Originally posted by rburnsnote also friend that the 1357.25 to 1351.25 move could be a projection to 1341.50 if the current low doesnt hold tomorrow!..So lets keep that in mind...Either way, i believe this to be a dynamic buying opp.
Thanks Koolio
Correct me if I'm wrong... but it looks to me... YOU NAILED IT! How do you do that? That's freakin AWESOME!
Emini Day Trading /
Daily Notes /
Forecast /
Economic Events /
Search /
Terms and Conditions /
Disclaimer /
Books /
Online Books /
Site Map /
Contact /
Privacy Policy /
Links /
About /
Day Trading Forum /
Investment Calculators /
Pivot Point Calculator /
Market Profile Generator /
Fibonacci Calculator /
Mailing List /
Advertise Here /
Articles /
Financial Terms /
Brokers /
Software /
Holidays /
Stock Split Calendar /
Mortgage Calculator /
Donate
Copyright © 2004-2023, MyPivots. All rights reserved.
Copyright © 2004-2023, MyPivots. All rights reserved.


