ES MAP for 4-29-11
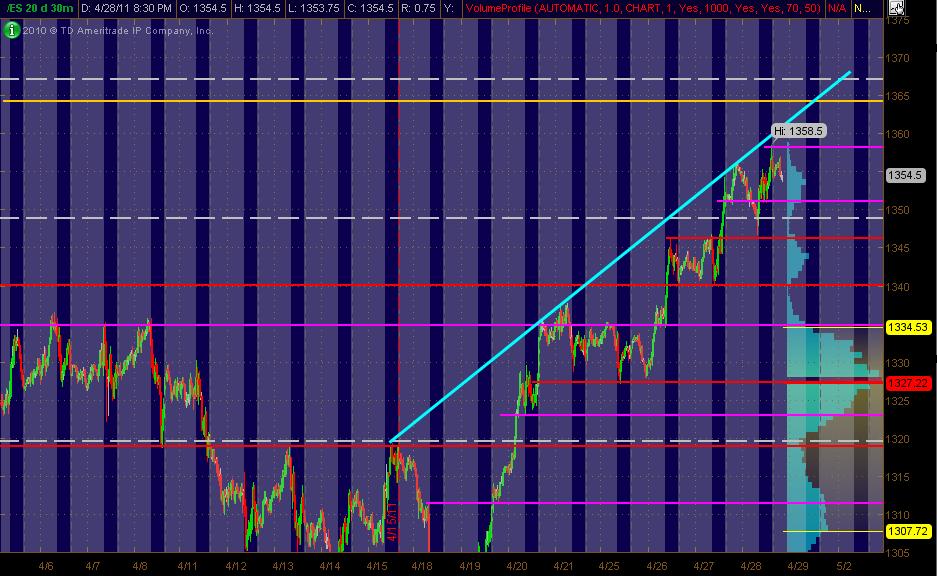
Here's what I've got looking at the ES 30min chart of 20 days. The Gray background is the "overnight" trading. The right vertical axis shows the 20-days worth of Volume at Price in Light Blue. The Red lines are my PASR "zones" of potential S/R with the Magenta potential semi-significant. The White dashed lines are the Weekly Pivots.
Have a Yellow line above the current market that looks like a potential significant Fib cluster area to me. Also, I've drawn in a Cyan trendline across the top swings of prices. I've adjusted some of the lines/levels/zones since the last posting of my "map". Hope it's helpful to both ES and equity traders!
Have a Yellow line above the current market that looks like a potential significant Fib cluster area to me. Also, I've drawn in a Cyan trendline across the top swings of prices. I've adjusted some of the lines/levels/zones since the last posting of my "map". Hope it's helpful to both ES and equity traders!
Also you have Nasdaq working for you, lagging due to RIMM being whacked
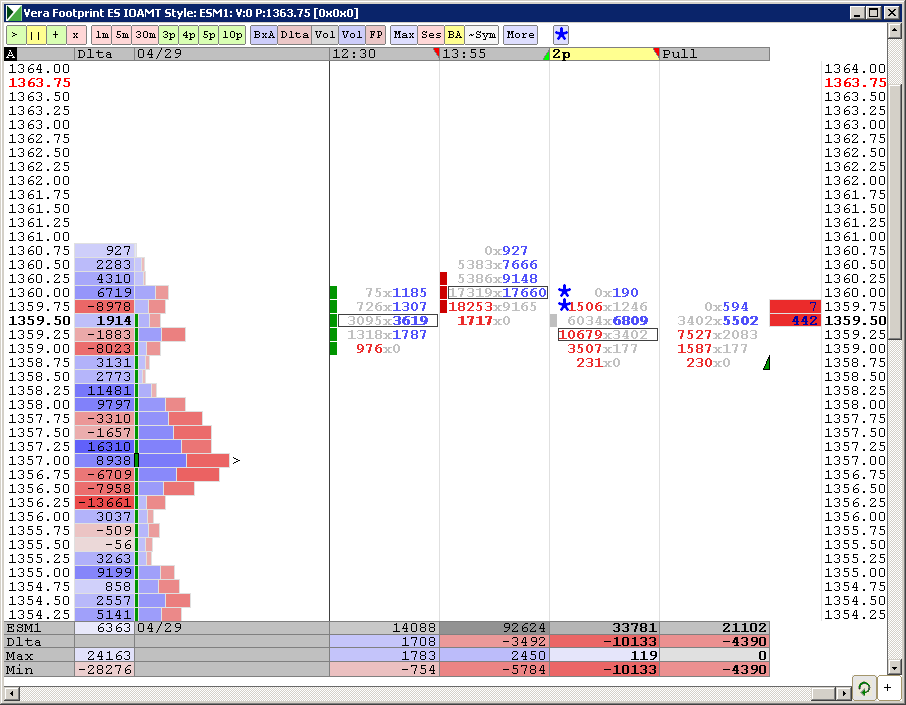
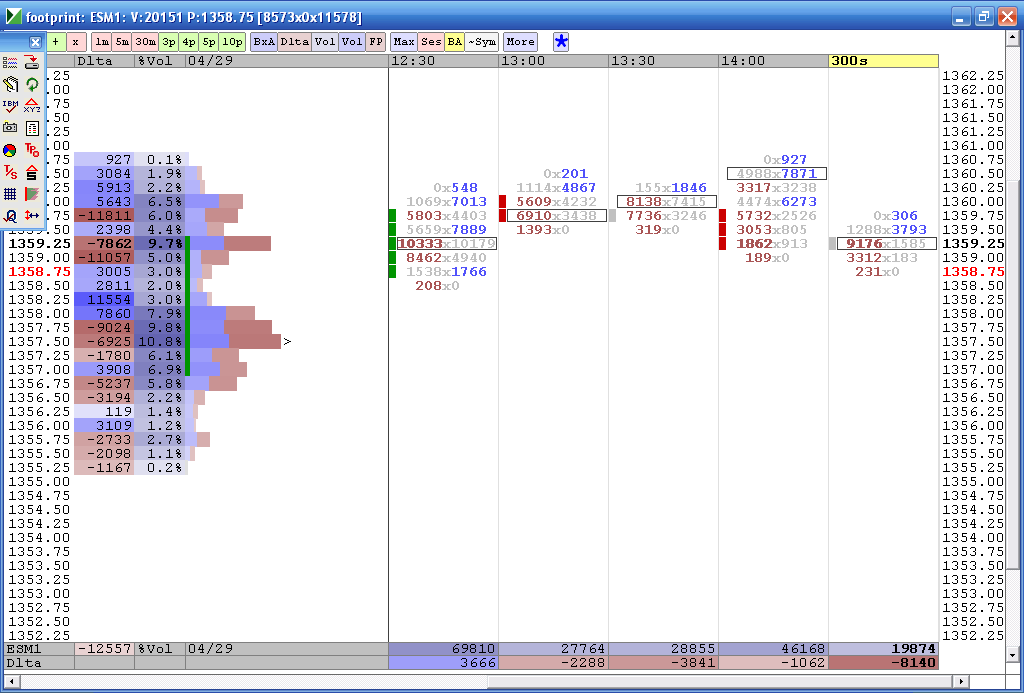
a look at what I'm talking about : Volume at 59.25 is trying to extend out further then the volume node at 57.50...so if we spend more time at the 59.25 then that will be the new peak volume....now if you look to the left of the % (percent) signs...you will see Blue or red and numbers...that is the delta at price....and you can see at the 59.25 area that delta has large red ( negative ) numbers....
I also have the % of volume so u can see that 57.50 still leads as a percent of volume but 59.25 is trying to catch up
Most of you know this stuff...and I'm just rambling about it to see if it makes sense and it has any real benefit
I also have the % of volume so u can see that 57.50 still leads as a percent of volume but 59.25 is trying to catch up
Most of you know this stuff...and I'm just rambling about it to see if it makes sense and it has any real benefit
Originally posted by Lisa P
Bruce, Hint: we are in an uptrend AND at end of the month....lol
Bruce is a Fader and from what i know, rarely rides trends. His methods are based off the IB (60 min), pull backs. rth hi,lows close etc.
LisaP,
what you are implying (or perhaps I am inferring) is that cum delta isn't worth much in a trending market.
what you are implying (or perhaps I am inferring) is that cum delta isn't worth much in a trending market.
59.25 is still the magnet...gonna take more than new highs to stop out my last 3....I'll need to see a change in the internals
Bruce, I am really bothered now by the difference in your and mine charts. Would be good to confer and compare chart settings.
I have to leave soon, so maybe we can do it on weekend or next week. Alternatively, I can stop posting my charts.
Paul, cum delta on Bruce's chart is shown for a time "slice", think it was 5 min. All we can see that market is going up on a low volume, which is typical for the "dolldrums".
I have to leave soon, so maybe we can do it on weekend or next week. Alternatively, I can stop posting my charts.
Paul, cum delta on Bruce's chart is shown for a time "slice", think it was 5 min. All we can see that market is going up on a low volume, which is typical for the "dolldrums".
Originally posted by PAUL9
LisaP,
what you are implying (or perhaps I am inferring) is that cum delta isn't worth much in a trending market.
That's kinda rude Lisa considering you have never posted a trade in advance.........
and I'll admit that I lose when we trend.....I don't have it like that today...so perhaps my last runners won't get full target...perhaps they will actually take away from money I just made....perhaps we won't retest that big one minute volume bar that has 59.25 as it's key price, perhaps you think price doesn't attract back...
I didn't see where you bought...?
You implied after the fact before that you got long at 59.25....did u exit....Not sure what your trying to say...
These distractions are good for me because I'm not watching the screen so much....
Optimus my friend , I would say that I NEVER catch the trend...LOL..
Originally posted by Lisa P
Bruce, Hint: we are in an uptrend AND at end of the month....lol
LisaP,
Please don't stop posting charts.
The footprint meaures are of great interest to me, but I know from looking at other things (like chart price patterns) that it takes a while (for me) to establish "rules of engagement" that would work most of the time.
Today is a peculiar day because it is both end of week options and end of month options and the market makers have access to a helluva lot more capital than I/we do.
Strength in euro versus the dollar is a floor for prices, too. when that breaks lower (dollar strength) thee will be selling in the ES.
real close to having that peak volume flip..then it will get interesting
took one off at 58.75...we are at vwap and YD highs....peak volume still below....they may need to get back to 59.25 ..just not sure..
took one off at 58.75...we are at vwap and YD highs....peak volume still below....they may need to get back to 59.25 ..just not sure..
wow, now that is what I call dumb luck as an exit...!! I guess they like that 57.50 !!
Emini Day Trading /
Daily Notes /
Forecast /
Economic Events /
Search /
Terms and Conditions /
Disclaimer /
Books /
Online Books /
Site Map /
Contact /
Privacy Policy /
Links /
About /
Day Trading Forum /
Investment Calculators /
Pivot Point Calculator /
Market Profile Generator /
Fibonacci Calculator /
Mailing List /
Advertise Here /
Articles /
Financial Terms /
Brokers /
Software /
Holidays /
Stock Split Calendar /
Mortgage Calculator /
Donate
Copyright © 2004-2023, MyPivots. All rights reserved.
Copyright © 2004-2023, MyPivots. All rights reserved.


