ES Short Term Trading for 4-21-11
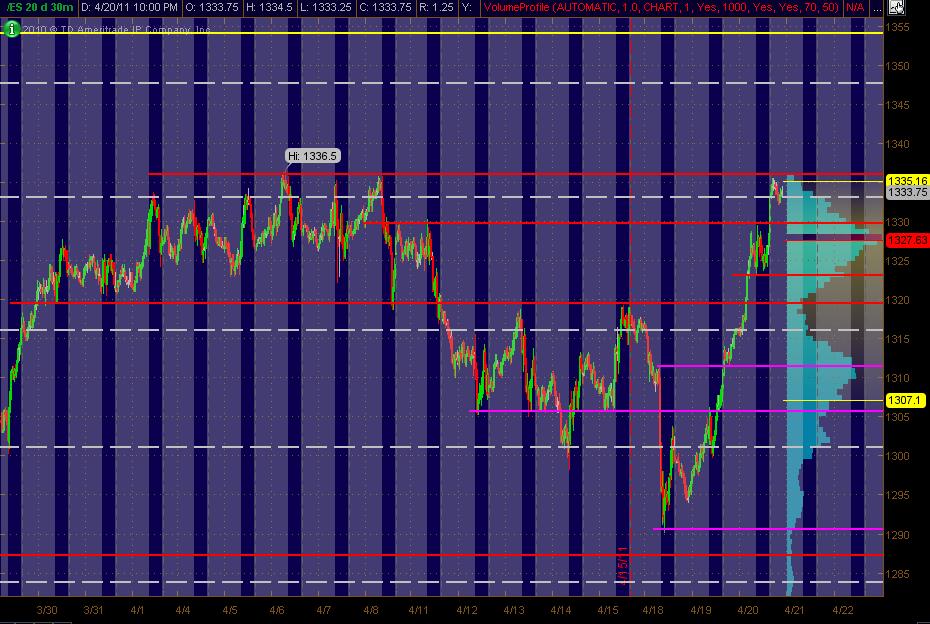
Here's my MonkeyMap of the ES 30min chart of 20 days. The Gray background is the "overnight" trading. The right vertical axis shows the 20-days worth of Volume at Price in Light Blue. The Red lines are my PASR "zones" of potential S/R with the Magenta potential semi-significant. The White dashed lines are the Weekly Pivots. Have a Yellow line above the current market that looks like a potential significant Fib cluster area to me. Hope this helps some in this whacky current market action!
Don't have much in the way of PASR above what is a 3 year high for now ... my bad!
Don't have much in the way of PASR above what is a 3 year high for now ... my bad!
Back, and it doesnt look like i missed much!
I dont think i could draw a straighter line
i got rid of my runner at roughly breakeven (1333.00) to preserve a profitable trade, and because i live by the old axiom, what cant seem to go down ,is gonna go up
Originally posted by mrgpre holiday trading ,with all the big money gone... i expect this non- action, but with an upward bias today.
I dont think i could draw a straighter line
Originally posted by BruceM
Hey Lorn...is your CD getting worse as we push up right now...I'm showing CD weakening on these attempts to go higher right now
It has weakened a little in this sideways consolidation but nothing I'd write home about.
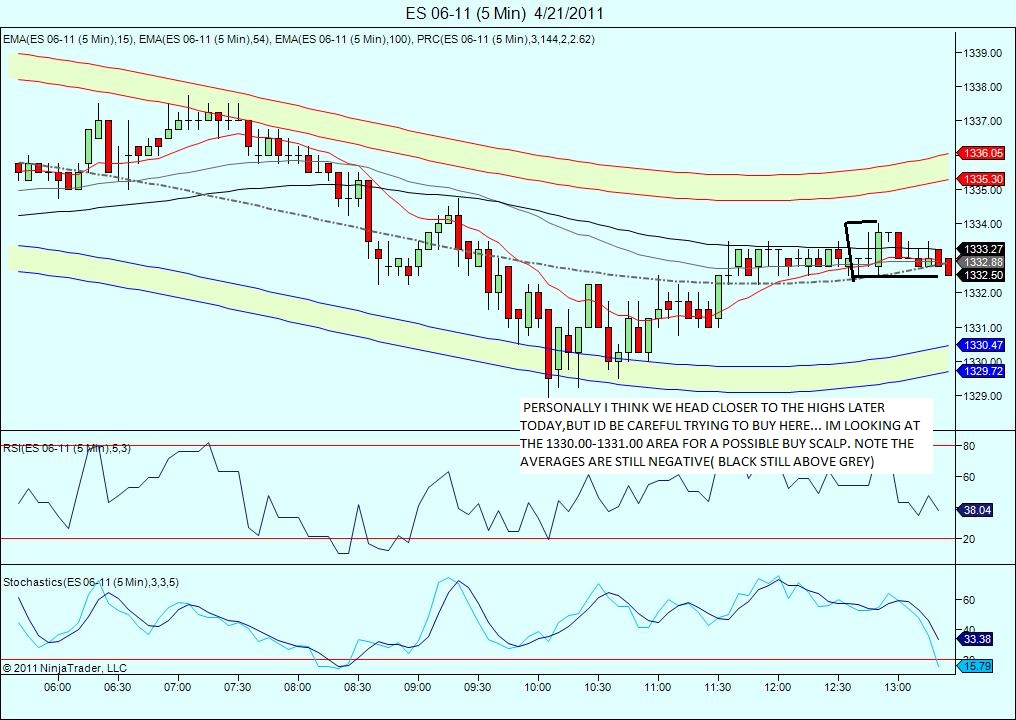
Well, we could stop right at 1331.00, but im going to slightly adjust a buy scalp target to the 1329.50-1330.50 range... trying to be very cautious !
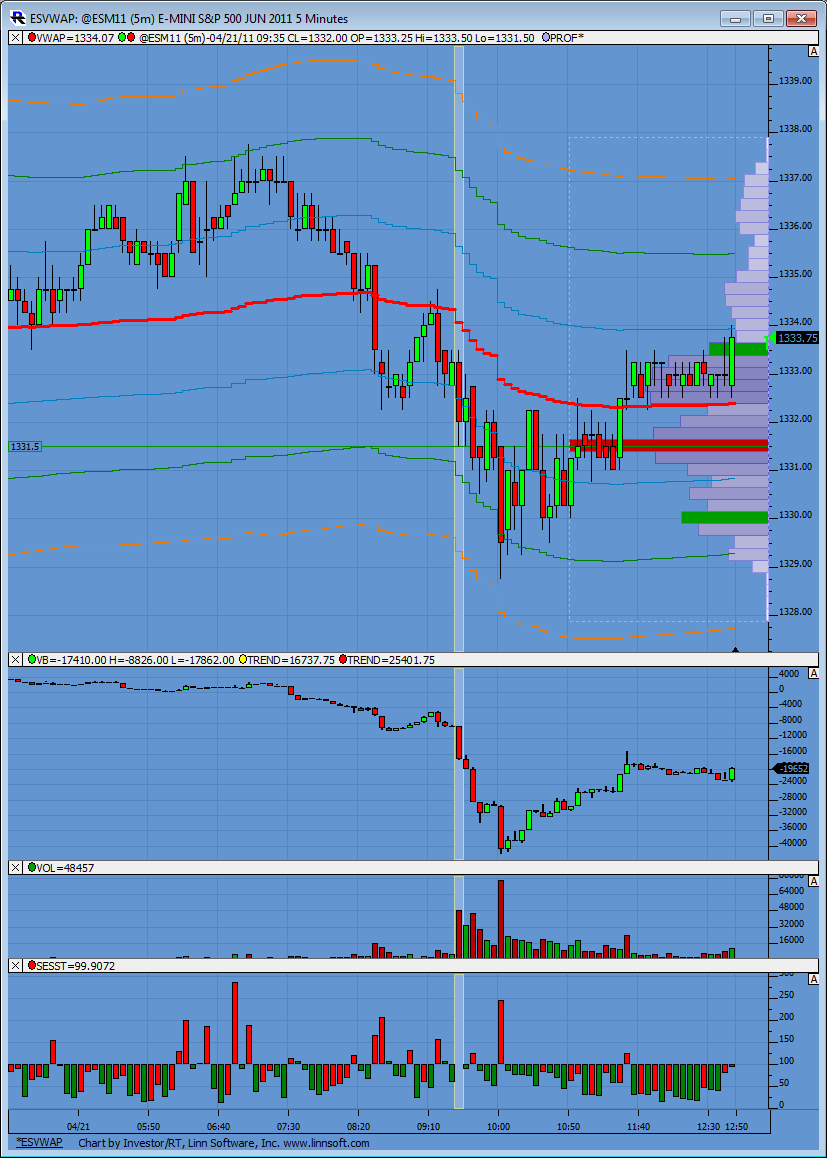
that's me done 4 on and 4 off at 31.50 print ...a perfect hit on the vwap and POC.....don't diddle in the middle !A better example u won't find...at least not today
Look how CD diverged as we made new highs on the days...now look at your $ticks ..not shown here and look at your volume shown here...classic example of price trying to push away from a volume node -VWAP combo....on low volume !
Look how CD diverged as we made new highs on the days...now look at your $ticks ..not shown here and look at your volume shown here...classic example of price trying to push away from a volume node -VWAP combo....on low volume !
well done ,Bruce!
boring action today!.. Im going to start my weekend... same opinions still apply ,however... Hope everyone has an enjoyable holiday!
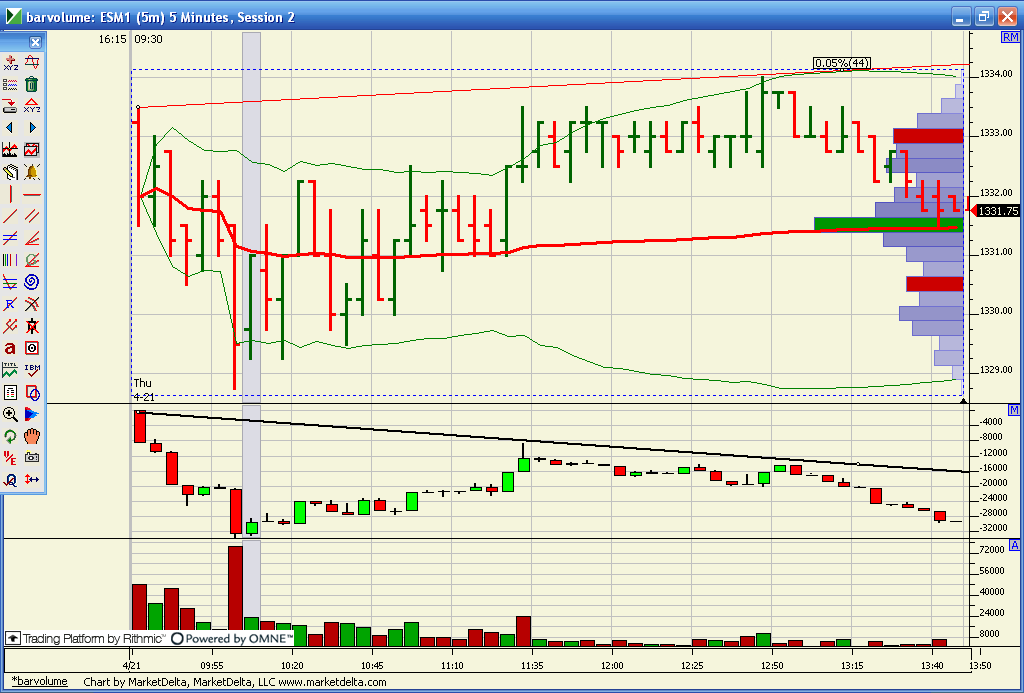
Well, i just woke up from my nap and was about to post how it looks like 1331.00 held it, but check out the last 4 min of trading!...ha! Crafty bastards! too late to take advantage of!... c ya next week!
Emini Day Trading /
Daily Notes /
Forecast /
Economic Events /
Search /
Terms and Conditions /
Disclaimer /
Books /
Online Books /
Site Map /
Contact /
Privacy Policy /
Links /
About /
Day Trading Forum /
Investment Calculators /
Pivot Point Calculator /
Market Profile Generator /
Fibonacci Calculator /
Mailing List /
Advertise Here /
Articles /
Financial Terms /
Brokers /
Software /
Holidays /
Stock Split Calendar /
Mortgage Calculator /
Donate
Copyright © 2004-2023, MyPivots. All rights reserved.
Copyright © 2004-2023, MyPivots. All rights reserved.


