ES Short Term Trading for 4-19-11
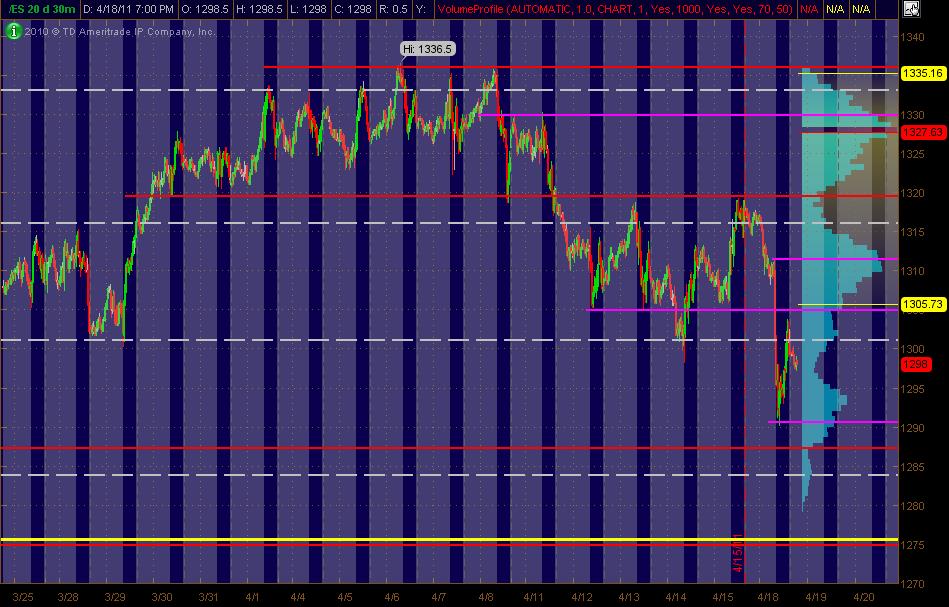
Here's my Monkey Map of the ES ... 30min chart of 20 days of activity. The right vertical axis shows Volume at Price with Blue bars. The PASR lines are in Red as potential significant S/R with Magenta as semi-significant. The White dashed lines are the Weekly Pivots. The Yellow line below the current market price is what I see as a potentially significant Fib Cluster. Hope this helps some folks!
Equity LONG setups for equity players ... if the market holds up or moves up. Otherwise, it's a collection of stocks that can function as an indicator, as I've described on other posts. Hope it's helpful!
OPEN (alread had a run up today)
NTES
LUFK (an energy stock)
ULTA
BIIB
BIDU
PCLN (wtf ... are they ever gonna stock-split this MF?)
DECK
JAZZ
Lots of these are higher priced and can be erratic intraday. But suggest anyone watch 'em collectively, comparing with the intraday movement with the ES.
OPEN (alread had a run up today)
NTES
LUFK (an energy stock)
ULTA
BIIB
BIDU
PCLN (wtf ... are they ever gonna stock-split this MF?)
DECK
JAZZ
Lots of these are higher priced and can be erratic intraday. But suggest anyone watch 'em collectively, comparing with the intraday movement with the ES.
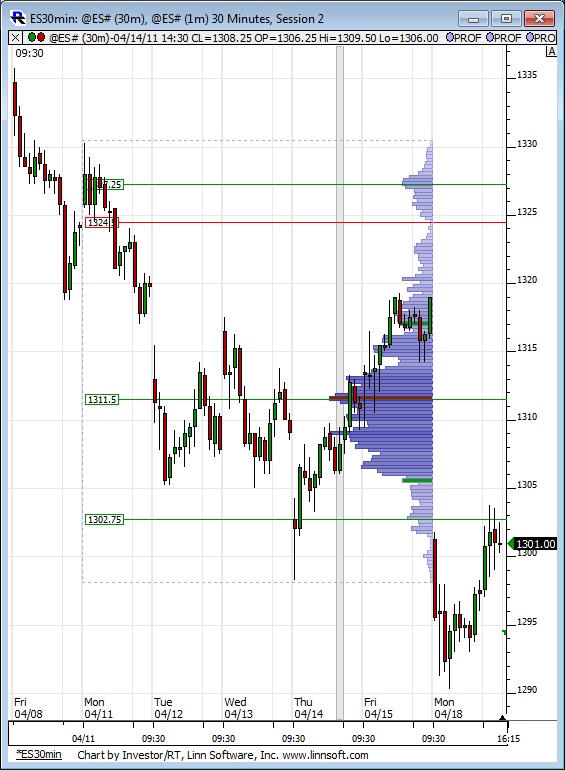
Here is a fascinating look at last weeks RTH profile and prices so far finding resistance on the 1302.75 HVN.
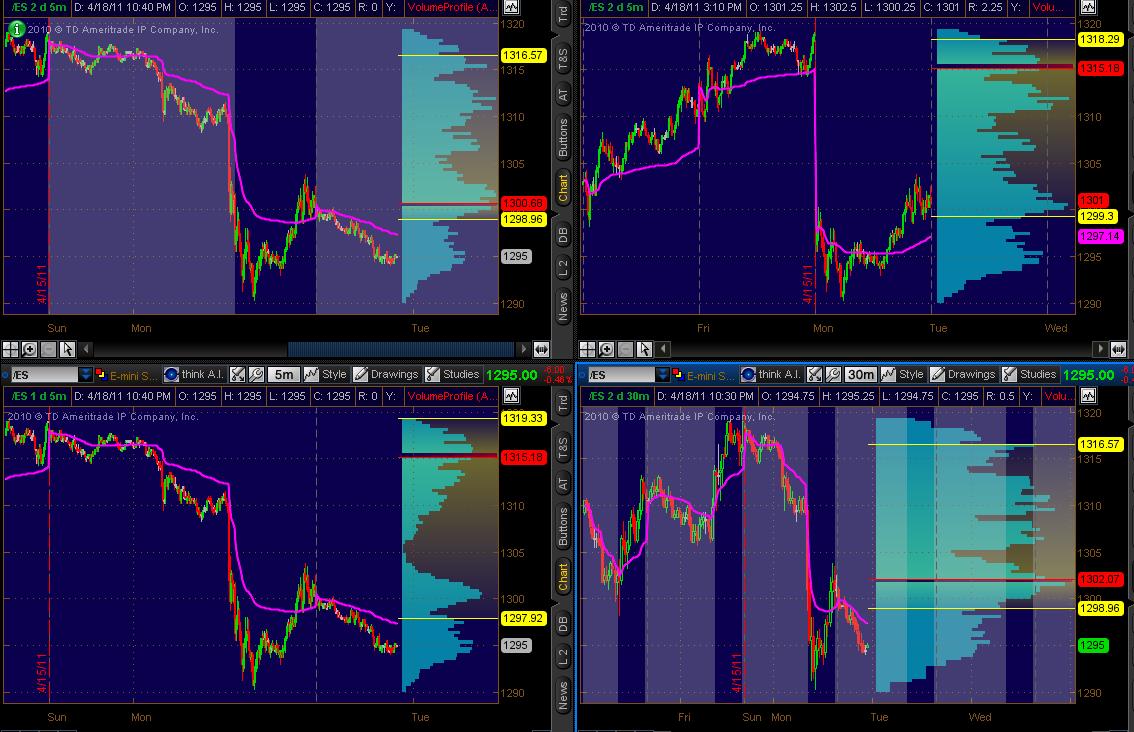
Tingering with Thinkorswim for ES ... to show Volume at Price and VWAP for a few time frames and RTH plus All Trading Hours. Am interested in feedback if this is useful/helpful. Lorn already posts some great stuff. I don't want to duplicate/waste time and space. But if this ADDS to it, then let me know. And Lorn, fill me in if my software calculations for both VaP and VWAP are inappropriate for whatever reason!
The gray background on two of the charts represents "overnight trading." The Light Blue lines on the far right vertical axis are Volume at Price with the Magenta line as VWAP.
There are 4 charts:
1. ES 5min 2 day chart of ATH (upper left)
2. ES 5min 2 day chart of RTH (upper right)
3. ES 5min 1 day chart of ATH (lower left)
4. ES 30min 2 day chart of ATH (lower right)
Let me know if any of my s$!t's "off" or if I'm employing any wrong time frames etc.
The only thing I would question is the VWAP...VWAP = volume weighted average price, so it shouldn't change no matter what time frame one uses. The only thing that would change VWAP is the session setting.
So I'd be interested in knowing how they calculate VWAP to make it change for time frames.
So I'd be interested in knowing how they calculate VWAP to make it change for time frames.
lorn, i have noticed huge differences in Vwap's
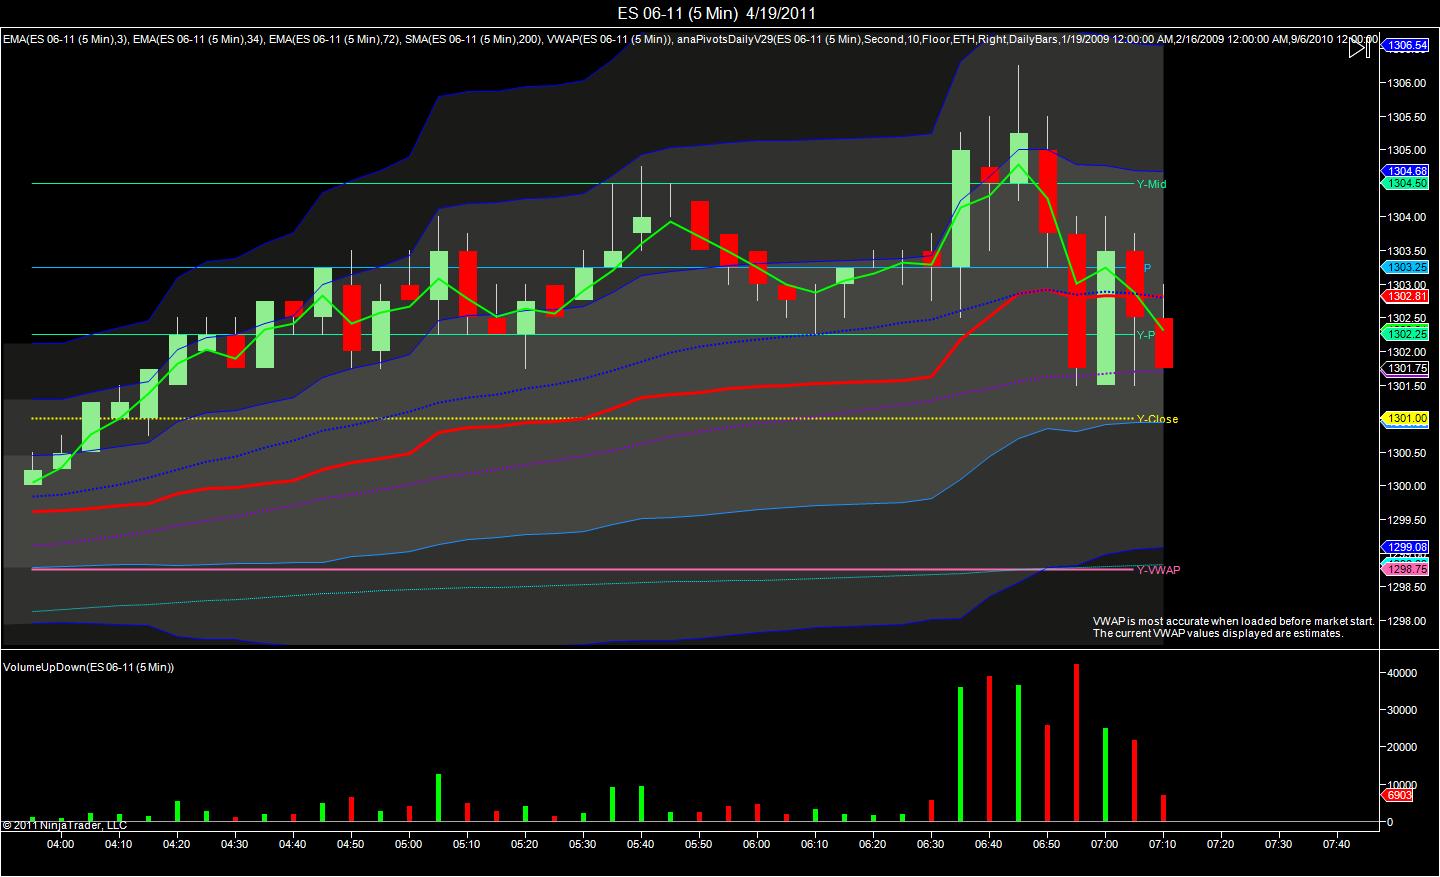
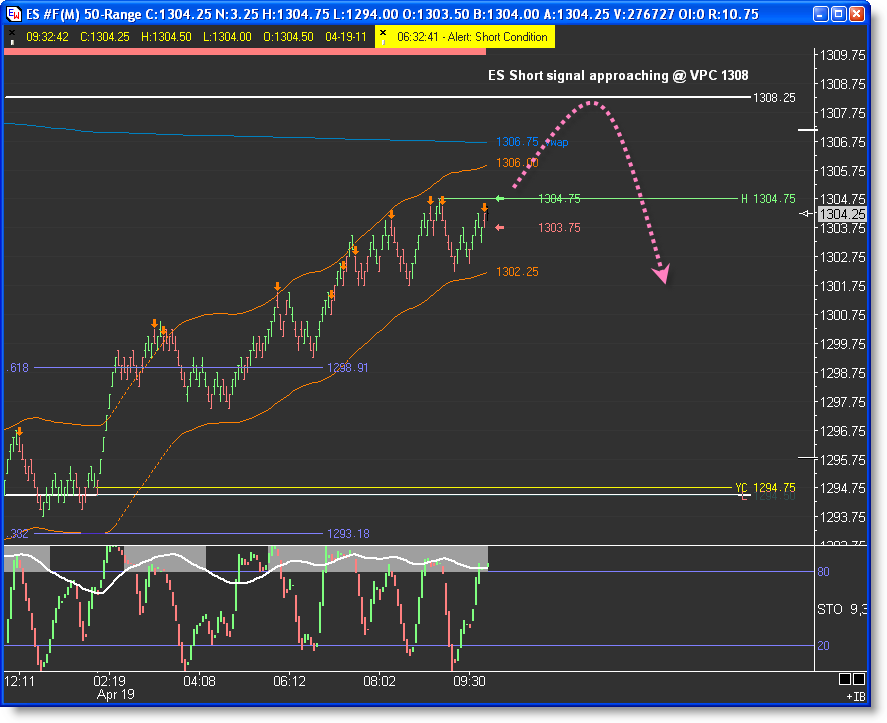
for example, here's a picture of mine @1302.82 currently and a picture of another's today @ 1306.75 at no time was my vwap at 1306 in the past 2 days. so how does this happen? even i adjust my chart to a 50-range( 1/2 point bars)it is still different. do you know how to adjust the vwap?
for example, here's a picture of mine @1302.82 currently and a picture of another's today @ 1306.75 at no time was my vwap at 1306 in the past 2 days. so how does this happen? even i adjust my chart to a 50-range( 1/2 point bars)it is still different. do you know how to adjust the vwap?
OP,
The only thing which should change VWAP output is if the originating point is different. For instance VWAP will be different if calculated using only RTH compared to using complete globex session.
Of course different platforms may have different formula's to calculate VWAP so most likely that is the culprit.
Most likely whatever formula you are using is calculating VWAP more like a Moving Average. Meaning it might have a period function in it whereby as a new period is added on the right side of the chart the left side disappears and is dropped from the output.
Looks like you have some Ethios.com exposure OP ! Have you read his latest book ? Looks like he goes on about VPOC's in it....might be an interesting read.
1313.75 - 1315 is a critical zone from Friday here in Tuesdays O/N session......above that is 1319 - 1320...Lots of internals including volume and $ticks diverging on this brief 2 day rally
On the downside for this O/N session I have 1310.50 as that is where all the volume came in and the 60 minute high at 1306 area from the day session....the big one is at 1301.75...that is big volume node from Tuesdays day session trade..lots of trade back and forth there on Tuesday
I'm trading for the 1310.50 retest from 1313.25.....it's almost a sure thing trade.....LOL.....NOT!!! My 9 year olds favorite word is now "NOT" !! a real wise guy!!
Rock on !!
Rock on !!
You got that
Richard
You got that
Richard
Emini Day Trading /
Daily Notes /
Forecast /
Economic Events /
Search /
Terms and Conditions /
Disclaimer /
Books /
Online Books /
Site Map /
Contact /
Privacy Policy /
Links /
About /
Day Trading Forum /
Investment Calculators /
Pivot Point Calculator /
Market Profile Generator /
Fibonacci Calculator /
Mailing List /
Advertise Here /
Articles /
Financial Terms /
Brokers /
Software /
Holidays /
Stock Split Calendar /
Mortgage Calculator /
Donate
Copyright © 2004-2023, MyPivots. All rights reserved.
Copyright © 2004-2023, MyPivots. All rights reserved.
