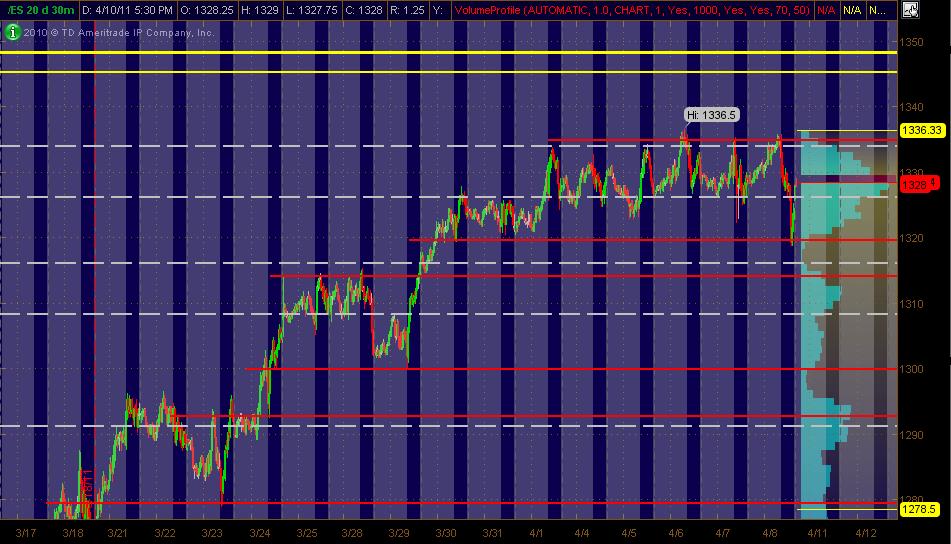
ES Trading for 4-11-11
Here's my MAP of the ES coming into the week ... 30min chart of 20 days with Volume Profile on the right vertical axis. The PASR levels are RED with the WHITE dashed lines being Weekly Pivots per mypivots.com with YELLOW lines being a "zone" of what I've got as potentially significant FIB clusters. Hope it's helpful
And for my fellow EQUITY traders who also track and trade the ES ...
Just thought I'd toss what I'm "seeing." We're up against significant resistance on the SP. But if the market moves up tomorrow (Monday) or over the course of the next few days, here's a few stocks I've got on my radar for potential LONGS:
SINA
TZOO
JAZZ
OPEN
DECK
SOHU
FOSL
(and a couple of questionables)
XEC
HUM
It'll be interesting to see where the ES opens in relation to Friday's close ... and where each of these stocks open ... comparing and evaluating 'em from a Relative Strength perspective. And of course, if the market sells down, I typically view any LONGS as out of play ... unless or until the overall market finds a place to at least bounce or reverse back up.
MM
from Fridays trade as per volume playbacks
1332
1327.50 - 1329.50 *******big dog of volume again
1324.50 **
1321.50 ***** buyers stepped in here....
as usual you should know where your RTH highs and lows are, the VA from the RTH session and the Overnight highs and lows.....many times you will see the value area numbers line up with the Peak volume nodes...that makes sense...
VA numbers as posted on the forum are 1332.75, 1327.25 and 1323.75....so very close to the playback numbers....but sometimes they miss good numbers...like the 21.50....I thinks that a big number...
with no reports scheduled there are good odds for the gap fill today...we are set to open inside the range of Friday...so selling into the 26 - 27 area now.....
trade outside the O/N high with volume would be trouble
trade outside the O/N high with volume would be trouble
core sells into 27.50
had to cover something at OR ...trying to hold two for gap fill
internals at even steven.... selling into 27.75....
I have real problems taking the time to post, but here's something that might be of interest
historically, Monday's are the worst day of the week to expect a gap up to fill (filling meaning printing at the 4:15 close of previous day)
about 3 out of 4 Mondays that gap up do not fill (this does not mean price won't have partial fill, and, statistically, there is a 1 in 4 chance for a fill)
historically, Monday's are the worst day of the week to expect a gap up to fill (filling meaning printing at the 4:15 close of previous day)
about 3 out of 4 Mondays that gap up do not fill (this does not mean price won't have partial fill, and, statistically, there is a 1 in 4 chance for a fill)
adding at 29.75...gonna get interesting now...triples on lows
not much buying interest up here at 1330.00
thanks for explaining that MM. Looks like we are heading down in the overnight to the next key area 1310.50- 1312.50.
Emini Day Trading /
Daily Notes /
Forecast /
Economic Events /
Search /
Terms and Conditions /
Disclaimer /
Books /
Online Books /
Site Map /
Contact /
Privacy Policy /
Links /
About /
Day Trading Forum /
Investment Calculators /
Pivot Point Calculator /
Market Profile Generator /
Fibonacci Calculator /
Mailing List /
Advertise Here /
Articles /
Financial Terms /
Brokers /
Software /
Holidays /
Stock Split Calendar /
Mortgage Calculator /
Donate
Copyright © 2004-2023, MyPivots. All rights reserved.
Copyright © 2004-2023, MyPivots. All rights reserved.
