ES 4-8-2011
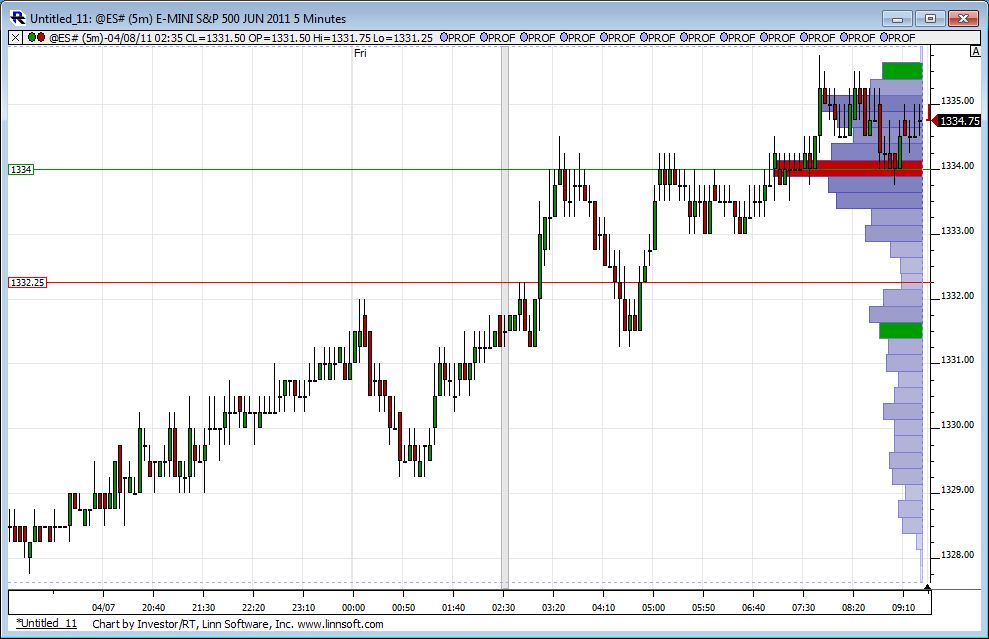
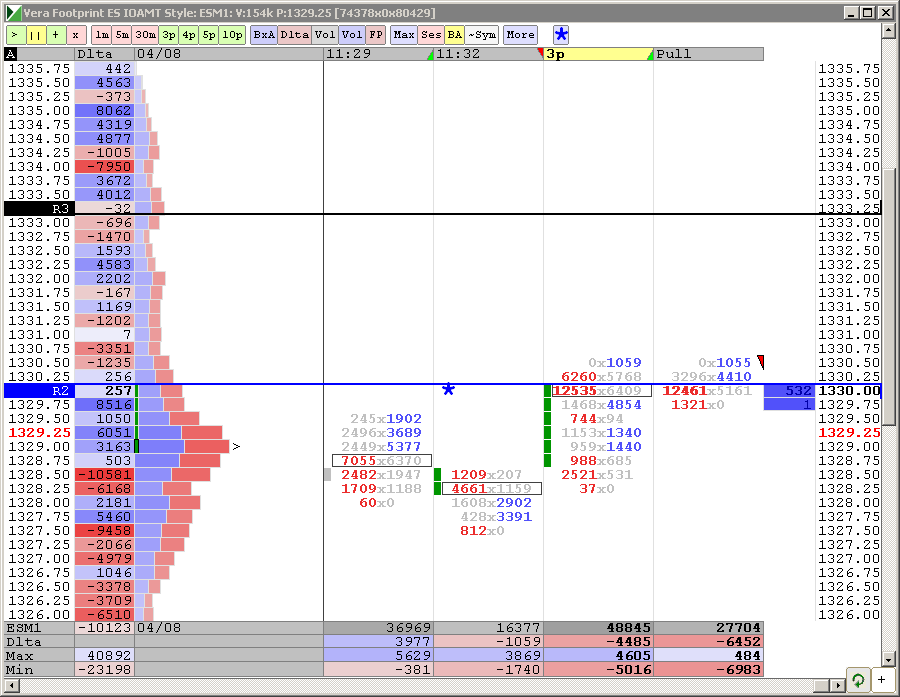
BEars are going to try again. This is a proper short for them (at resistance). This 1330 line is on my charts for a week now - still a significant number.
I see 23K shorts. IF they have to cover, we will have a fuel for the rocket up
Question:
How do you know these are new positions and not longs covering that are now flat?
How do you know these are new positions and not longs covering that are now flat?
Originally posted by Lisa P
I see 23K shorts. IF they have to cover, we will have a fuel for the rocket up
I was wondering the same thing yesterday afternoon...beyondMP...I was looking at all these shorts...( or at least volume at the bid side)...and it was after an up move......so what is to say that it just wasn't longs exiting the market?
Bruce and Beyond, my chart shows trades executed at bid on the left side of column and trades executed at ask on the right side. My understanding is that this data comes from the CME. You can check on that.
If a party (traders) really WANT to go short, they use market orders rather then limit orders - thus they get filled at bid. If more contracts filled at bid at particular level, that tells me that most traders want to short. I do not wait for a "better tick" if I want to get filled at particular level, neither does Mr.BigWig. He is not going to miss a trade because of one tic.
WHen that many longs cover, I imagine they would also hit market order and get filled at the ask. Who wants to have a big slip on a large order? Not Mr.BigWig.
That is my train of thought.
Of course nothing is fool-proof, as recent action shows. I had a short trade, flipped it to long, and got stopped out. So there - nothing is perfect; I am doing my best. That will remind me not to trade at lunch time, when I am busy with other things.
Going away tomorrow. Wishing everyone good trading. :-)
Originally posted by beyondMP
Question:
How do you know these are new positions and not longs covering that are now flat?
Originally posted by Lisa P
I see 23K shorts. IF they have to cover, we will have a fuel for the rocket up
Lisa P
Thank you for the explanation.
Thank you for the explanation.
Lisa P
"WHen that many longs cover, I imagine they would also hit market order and get filled at the ask. Who wants to have a big slip on a large order? Not Mr.BigWig."
Why would longs hitting market orders not get filled on the bid, along with those new shorts?
I'm sorry if I'm missing something here, just hoping for a better understanding.
The longs that are looking to exit.
see previous post.
see previous post.
Sorry, meant shorts cover, not longs. When trade does not go lower as expected by those shorts, both hit ask - covering shorts and initiating longs. Sorry busy with other things thus sloppy post.
I think the problem at these levels is that 30 min 24-hr chart is fighting with RTH chart: one is in uptrend the other in downtrend, thus cofusion among traders at current support. Plus lunch time. Hope answered your question.
I think the problem at these levels is that 30 min 24-hr chart is fighting with RTH chart: one is in uptrend the other in downtrend, thus cofusion among traders at current support. Plus lunch time. Hope answered your question.
LisaP:
I was just trying to figure out how you knew that there was 23k actual shorts before. I was hoping you found something in the "footprint" charts, because that would be a great help if you could get that from them.
Thanks again.
I was just trying to figure out how you knew that there was 23k actual shorts before. I was hoping you found something in the "footprint" charts, because that would be a great help if you could get that from them.
Thanks again.
Lisa,
Mine are 5 minute bars.........yours seem different...have a safe trip
Mine are 5 minute bars.........yours seem different...have a safe trip
Originally posted by Lisa P
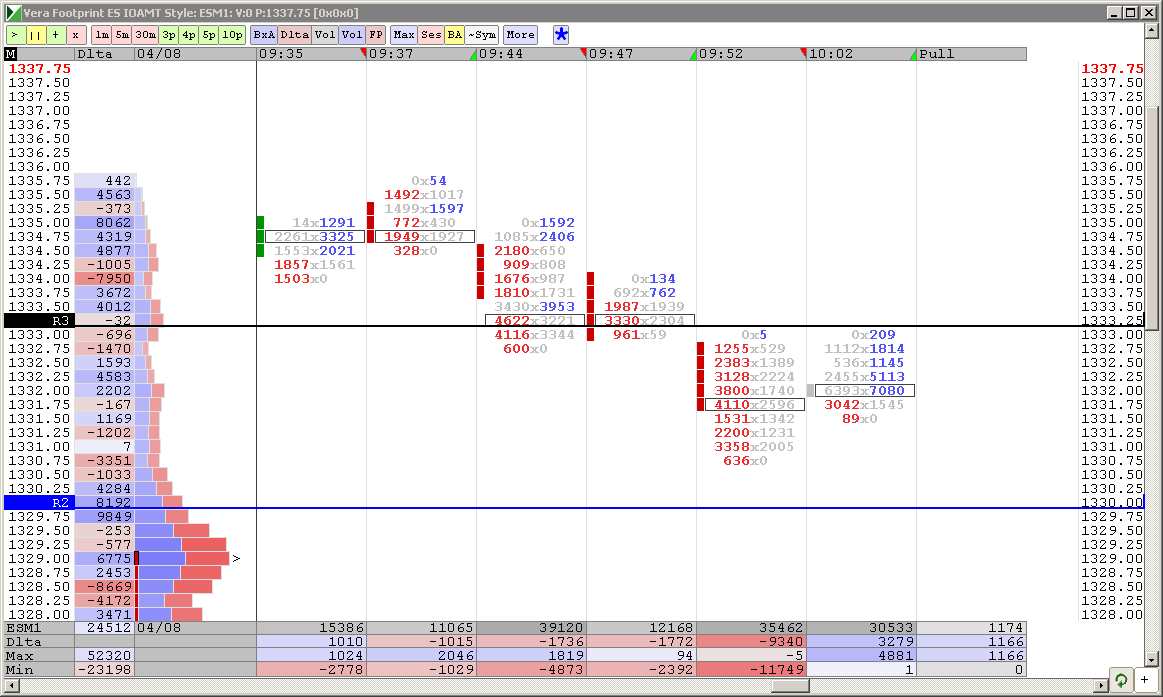
BruceM, my chart for the same period of time looks completely different - see below. Check your settings. Sorry cannot help more - leaving soon.
Originally posted by BruceM
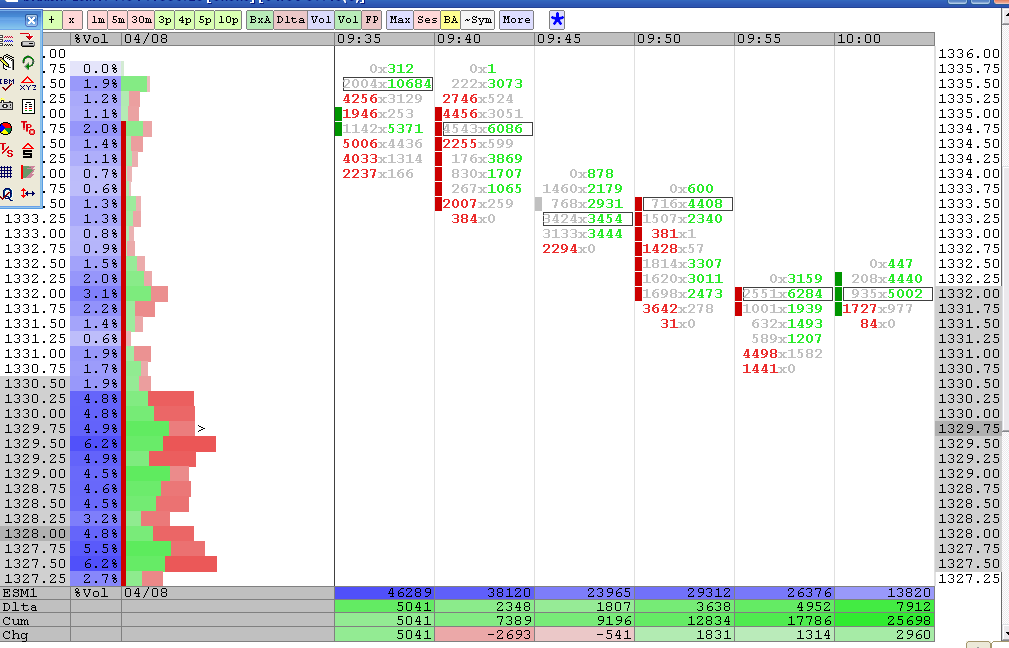
here is a case in point from the opening today of RTH...look at all that Green and cumulative delta is increasing on the way down..couldn't this just be the smart sellers exiting from the O/N positions?
The market never went up above 1333 after that swing low...
how to interpret this ?
Emini Day Trading /
Daily Notes /
Forecast /
Economic Events /
Search /
Terms and Conditions /
Disclaimer /
Books /
Online Books /
Site Map /
Contact /
Privacy Policy /
Links /
About /
Day Trading Forum /
Investment Calculators /
Pivot Point Calculator /
Market Profile Generator /
Fibonacci Calculator /
Mailing List /
Advertise Here /
Articles /
Financial Terms /
Brokers /
Software /
Holidays /
Stock Split Calendar /
Mortgage Calculator /
Donate
Copyright © 2004-2023, MyPivots. All rights reserved.
Copyright © 2004-2023, MyPivots. All rights reserved.


