ES 4-4-2011
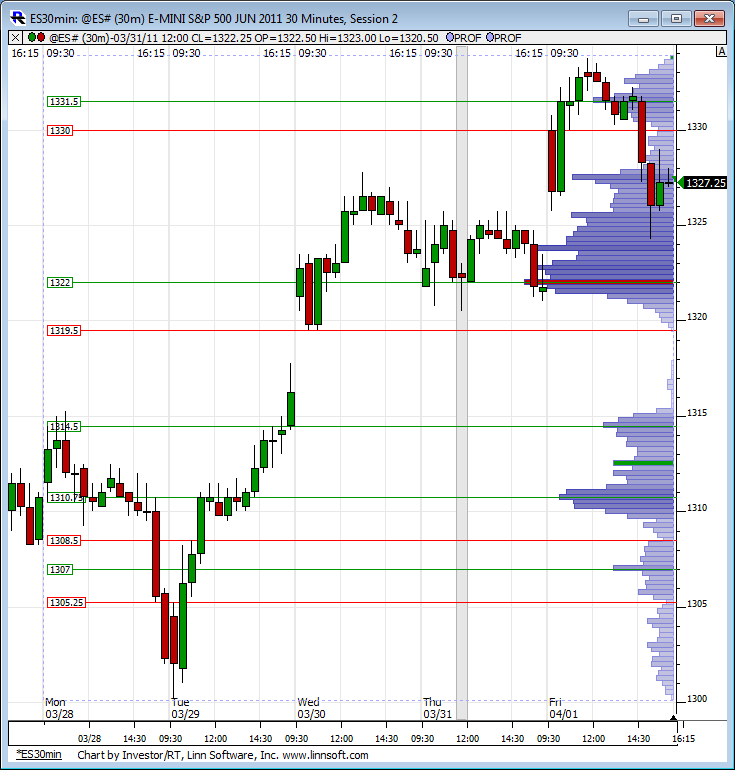
Getting the week started off here is a look at last weeks RTH profile.
Obvious zone on this chart is the gap in the middle with virtually zero volume.
Obvious zone on this chart is the gap in the middle with virtually zero volume.
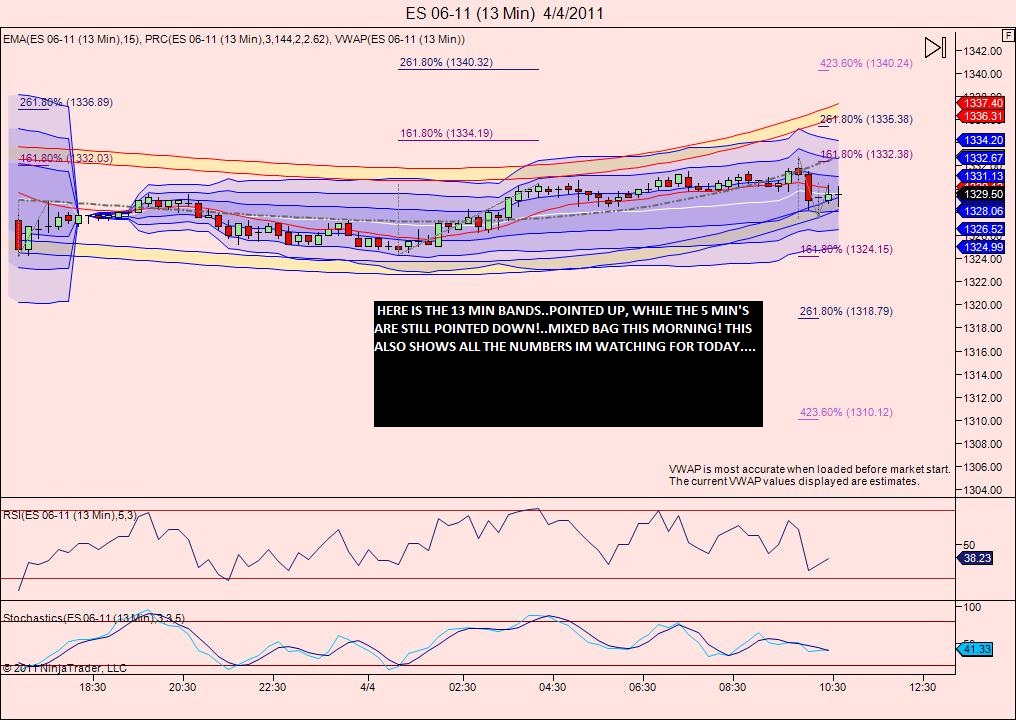
still looking for 1337 minimum.. on the downside,support at 1324.25 and 1318.50-1319.00.... watching
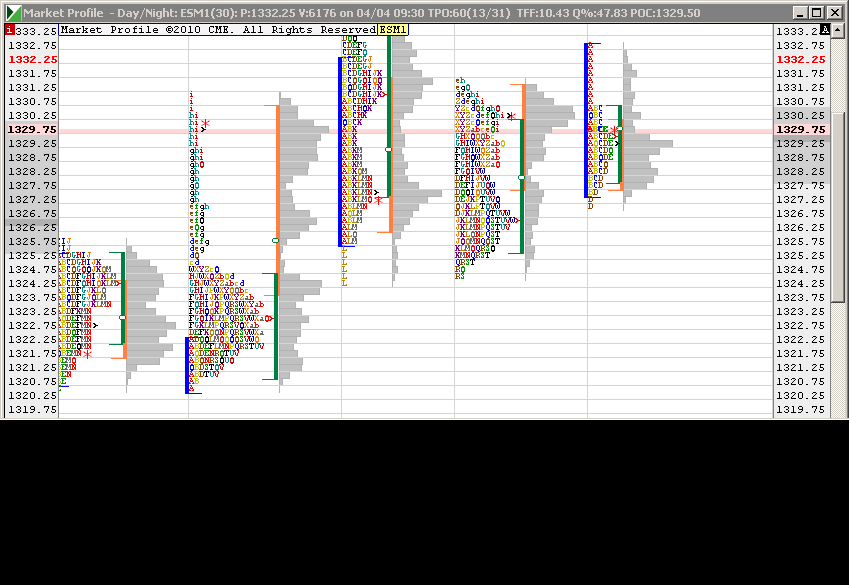
As the gap up was within fridays range, looking for a 'range' day as opposed to a trend day...
flat at 29.25..
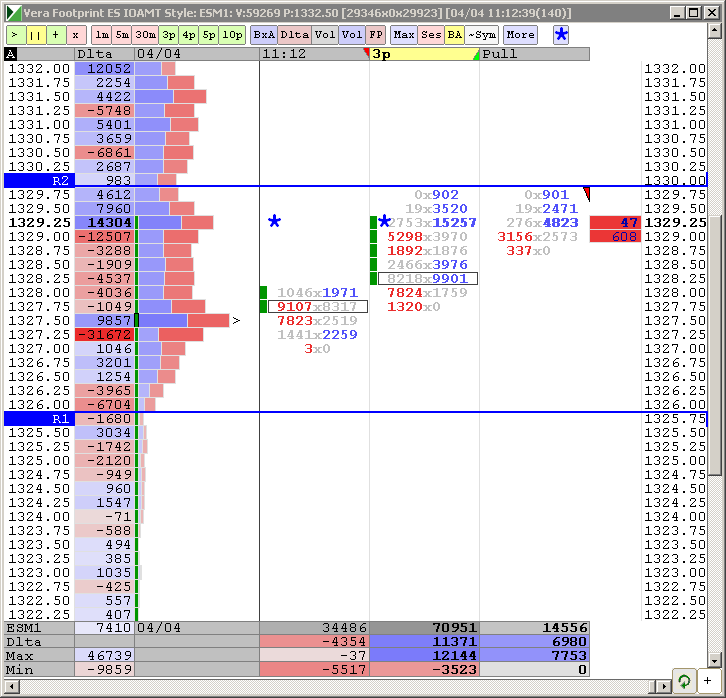
Decidely more selling than buying so far ,since the opening of the rth... but avg's on the 5 min are still in positive trend mode... we would need to spend considerably more time below 1329 to change that...
I bought into hour low and small.....I want to get out near that 28.75 but just missed an exit....sloppy...trade to 26.25 will stop me out.....day is showing the 'b' which implys that sellers are having trouble.......we'll see...I haven't forgot about dr. B's 95 % stat too
trying to hold one last contract for the test of 1330.50
Glad ya nabbed SOHU ... unfolded well. Considering the market was range bound, most of the stock picks held up well with many also reflecting the ES price activity ... but they performed pretty well overall ... with 1 or 2 semi-lemons. Thanks for the feedback; it's nice to hear back that someone's profited from the picks. Good stuff!
Emini Day Trading /
Daily Notes /
Forecast /
Economic Events /
Search /
Terms and Conditions /
Disclaimer /
Books /
Online Books /
Site Map /
Contact /
Privacy Policy /
Links /
About /
Day Trading Forum /
Investment Calculators /
Pivot Point Calculator /
Market Profile Generator /
Fibonacci Calculator /
Mailing List /
Advertise Here /
Articles /
Financial Terms /
Brokers /
Software /
Holidays /
Stock Split Calendar /
Mortgage Calculator /
Donate
Copyright © 2004-2023, MyPivots. All rights reserved.
Copyright © 2004-2023, MyPivots. All rights reserved.


