ES numbers for 3-25-11
These are the zones that I'm working from and the reasons why:
1314 - 1315 - Spike high in current O/N
1310 - R1 and current consolidation in ON
1304.75 - 1306.75 = VA high , RTH high and volume spikes
1301.50 ****** big key area number = closing VWAP, Pivot ( standard),
VPOC before it shifted and volume spikes
1295.75 - 1296.50 = S1, Volume spikes, VPOC before it shifted
1291.25 - 1292.50 = Old Vol spike from Wednesday and Thursdays low
1287.50 = Key volume area from Wednesday*******
Ranges are tight so numbers are a bit close together but will re -adjust in the morning
short 12.25
target 10, then 8.75, then 6
stop at 14.75, may flex to 15.5
target 10, then 8.75, then 6
stop at 14.75, may flex to 15.5
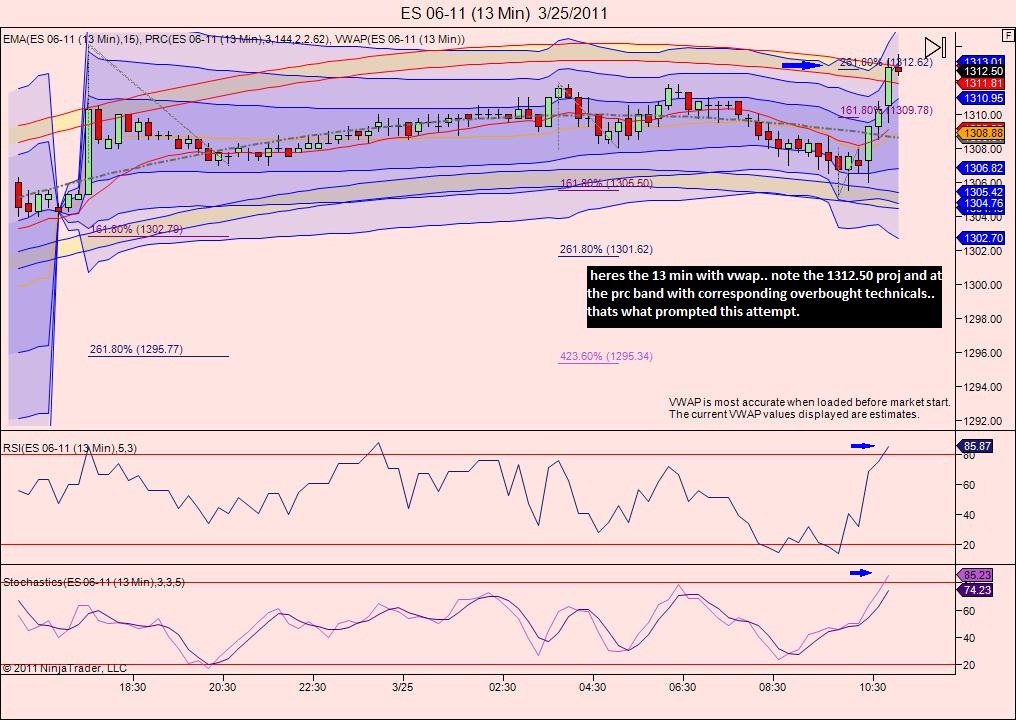
will take one off at 1311.00, and hold the runner for much lower... but i can only lower my stop(if i get that 1311) to 1313.50. Thats how i'll play it...short term avg's are about to induicate pos trend, but a mish-mash up and down today would not surprise me...
...Note that there is 13 min air at 1311.00 and a move back to the 1.618 1309.75 would not be surprising
Bruce,my RTH chart showed an old gap on 9-10 March. I keep track.
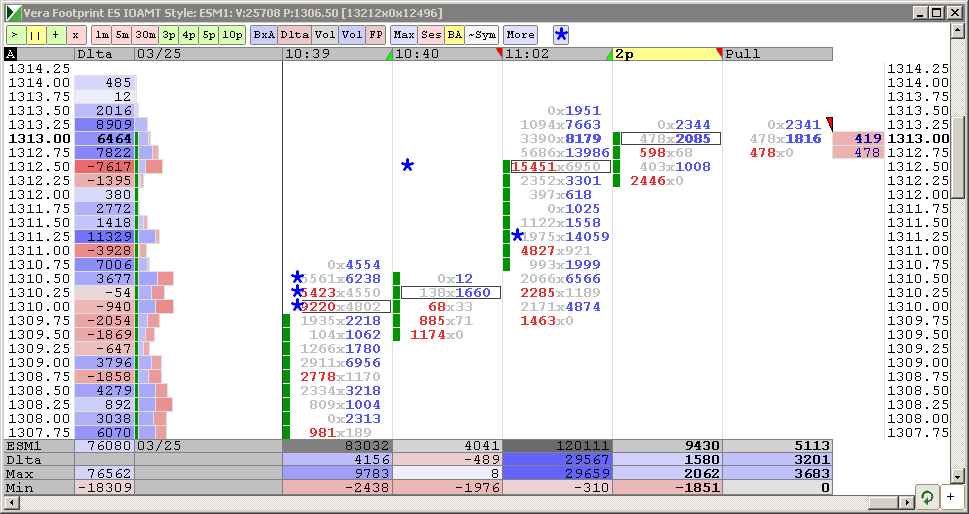
More volume at 1212.50-1212.75. I have nothing there, maybe someone else has. maybe on YM or NQ
More volume at 1212.50-1212.75. I have nothing there, maybe someone else has. maybe on YM or NQ
Just noticed - INDU hit 12,250 - so maybe round number
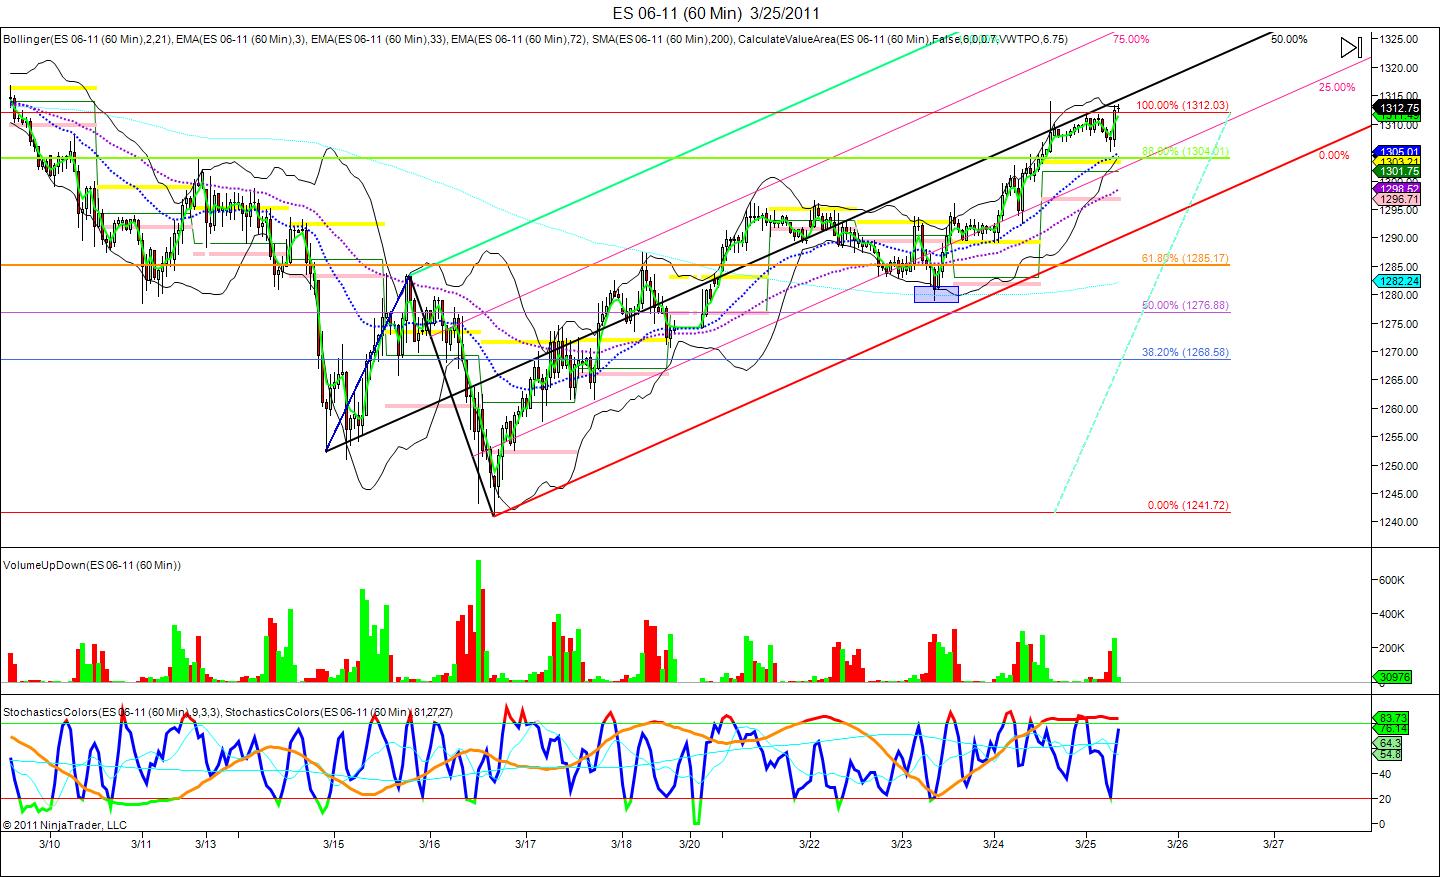
60 minute chart shows were are almost topped out, should get a pullback here at these levels, power through to 1320+ or, just creep up the median line until close.. that sounds like loads of fun. LOL
I have around 1314 as a TPO POC of that big daily pennant formed during late february-early March. This is based on my daily chart. Do not have M-Delta going that far.
Based on the spike last night (Globex high 1214, I assume that is where sellers camped. maybe the POC of that congestion. Comments from others are welcome.
Based on the spike last night (Globex high 1214, I assume that is where sellers camped. maybe the POC of that congestion. Comments from others are welcome.
Originally posted by G Runt
short 12.25
target 10, then 8.75, then 6
stop at 14.75, may flex to 15.5
Closed at .25 B/E minus comms. Don't trust the strength of DTX and the large buys going through.
back to small scalps only. I do see 1302 in the next trading day or 2.
Thanks for all the posters here and for going to the trouble of annotating and posting charts. I have learned some things I have never looked at.
I will begin posting some charts in the future as well. I have some extensive travel over the next few months, but I'll try and contribute some decent info when I can.
Have a great weekend everyone!
I will begin posting some charts in the future as well. I have some extensive travel over the next few months, but I'll try and contribute some decent info when I can.
Have a great weekend everyone!
Emini Day Trading /
Daily Notes /
Forecast /
Economic Events /
Search /
Terms and Conditions /
Disclaimer /
Books /
Online Books /
Site Map /
Contact /
Privacy Policy /
Links /
About /
Day Trading Forum /
Investment Calculators /
Pivot Point Calculator /
Market Profile Generator /
Fibonacci Calculator /
Mailing List /
Advertise Here /
Articles /
Financial Terms /
Brokers /
Software /
Holidays /
Stock Split Calendar /
Mortgage Calculator /
Donate
Copyright © 2004-2023, MyPivots. All rights reserved.
Copyright © 2004-2023, MyPivots. All rights reserved.


