ES on 3-18-11
Sometimes you get lucky. Got home from work and re-shorted the 1269 for an O/N trade, and placed order to cover @1262, which was the low during RTH. Just got back from family dinner, and lo and behold, my short was covered at 1262. Then ES shoots up to 1279+. New short placed at 1279.50. Whoever was watching that double bottom at 1262 early tonight and went long - congrats! Setting up for nice trade tomorrow.
Looking for churning sideways action today. Still one unit short @ 1279.50; looking to cover that @ 1275.25, and add a short @1282. Will see how that works out. Will follow at work.
congrats on your trade however, this type of post will most likely get you some negative feedback. posting trades after they happen is not what this site is about.
I second that
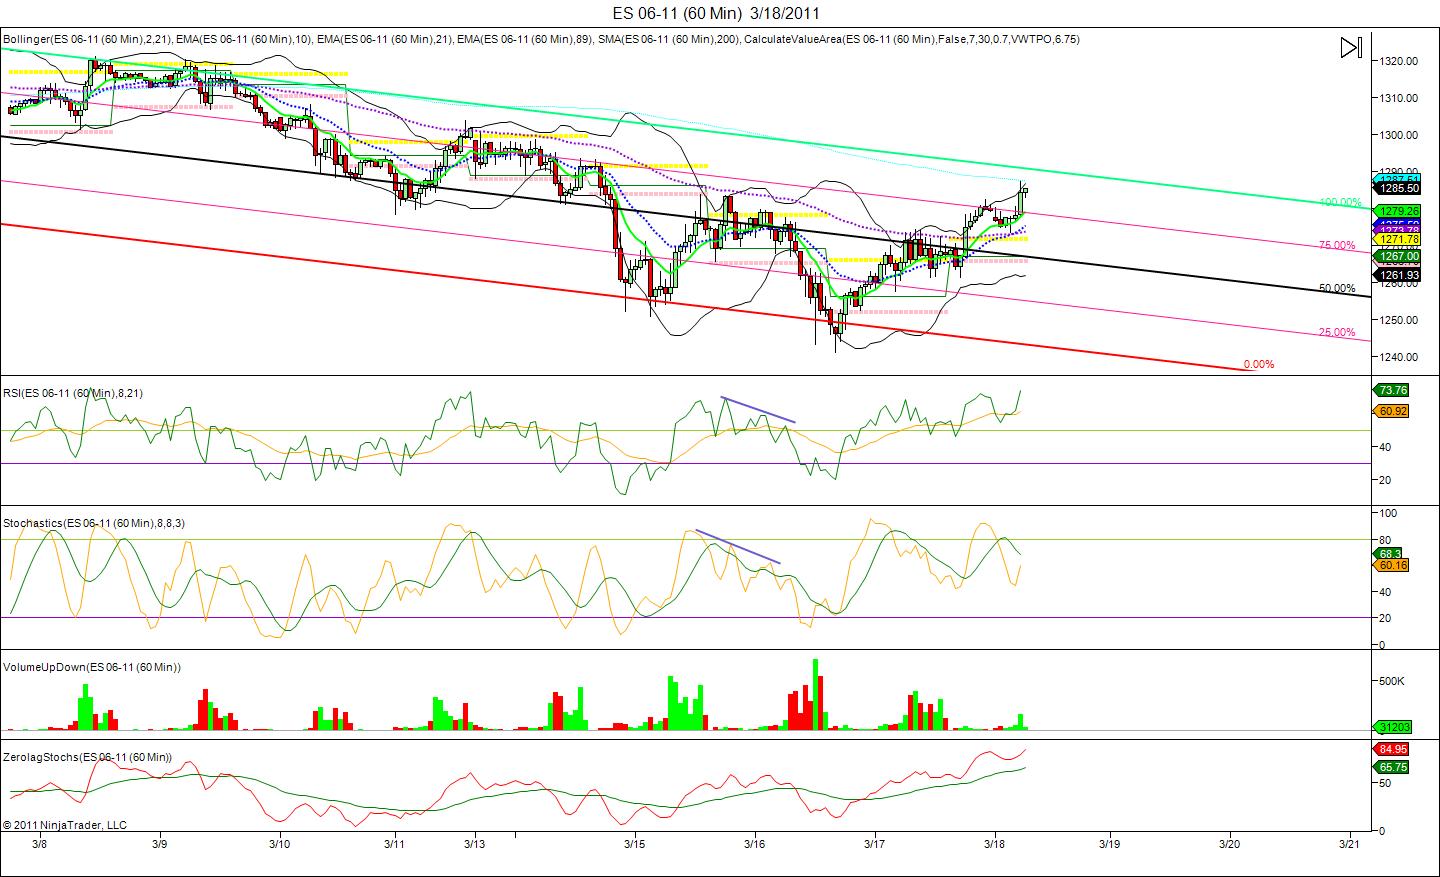
i stated yesterday we may hit 1290-1292 and we just may today 1287 seems to be a key level, this is the 200 EMA on my 60 minute chart shown here. i also see some resistance on a higher time frame(240) at 1299-1301
If you provided some rationale for the trades, the method/strategy of how and why you chose to enter and exit when and where you did, that would at least be educational and perhaps useful to others here. It's also nice to have a chart(s) to post displaying your analysis for the trade(s) as well. Just an idea Stevo. In the mean time, glad you had a profitable trade.
MM
MM
91.5 is Kools 261 on both 13 and 30 min
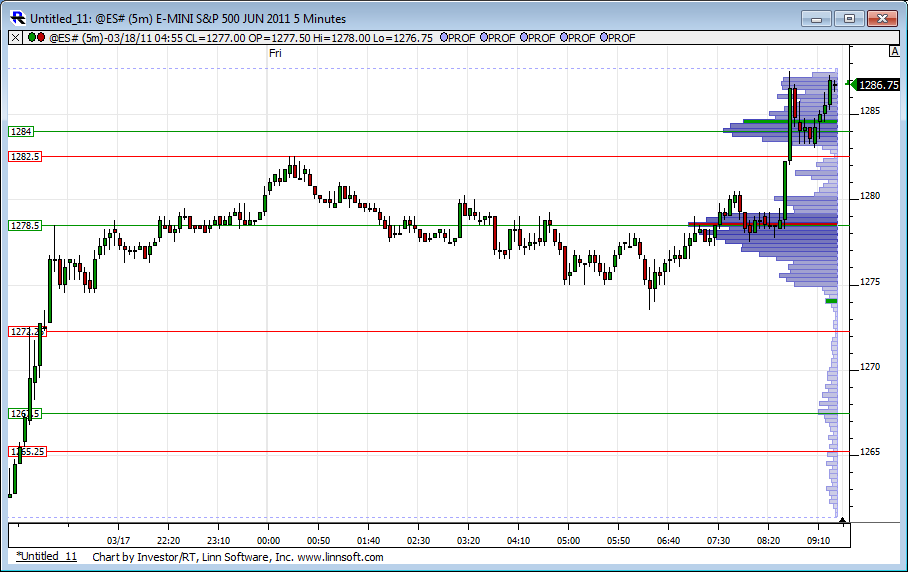
84 is the key volume...very important dividing line today
Greetings!
Great stuff here. Keep up the good work.
My bias today was long. I made two trades. Apparently there is a "ban" on non real-time trades, so I will simply ask for comments on the next few day's direction, starting on Monday 21 Mar.
My thoughts were we were going to at least hit 1292 today before heading back down. Generally speaking I only trade 1 - 2 times a day and place a single order that upon execution, triggers an OCO. After my first successful trade for the day, I entered my second trade at roughly 0905 hrs EST with a buy at 1283.50. My profit target was 1288.00. Obviously that did not hit as the high on the 0925 hrs bar is 1287.25.
The above is one of the disadvantages of not watching the ES tick by tick (I gave that up after several years of futures trading). My current method is more like fishing and no trades or a trade every other day is fine by me. I adopted this method from my success with swing trading stocks and I'm surprised at how well it works.
So, my post is a small introduction as well as a desire to solicit members thoughts on direction for the next week. I'll throw my hat in and say we'll visit 1300 before re-visiting the lows established this week.
Emini Day Trading /
Daily Notes /
Forecast /
Economic Events /
Search /
Terms and Conditions /
Disclaimer /
Books /
Online Books /
Site Map /
Contact /
Privacy Policy /
Links /
About /
Day Trading Forum /
Investment Calculators /
Pivot Point Calculator /
Market Profile Generator /
Fibonacci Calculator /
Mailing List /
Advertise Here /
Articles /
Financial Terms /
Brokers /
Software /
Holidays /
Stock Split Calendar /
Mortgage Calculator /
Donate
Copyright © 2004-2023, MyPivots. All rights reserved.
Copyright © 2004-2023, MyPivots. All rights reserved.

