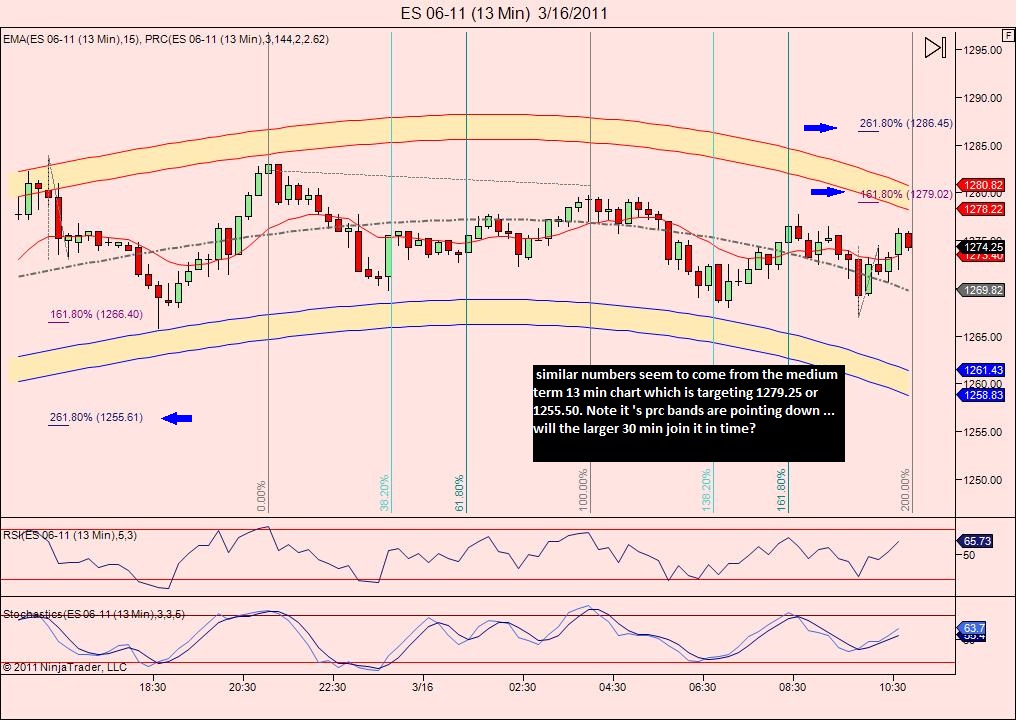
ES 3-16-2011
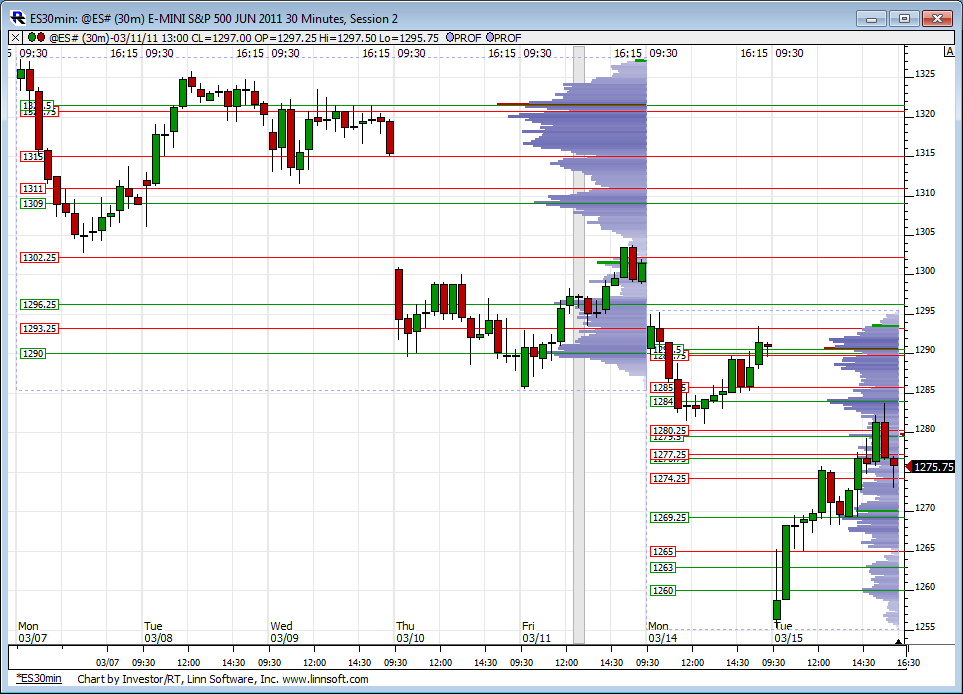
Thought I'd post profile for Monday/Tuesday along side last weeks profile. These are RTH only profiles. Quite a few unfilled gaps over the last several trading days. Have we found an important bottom here or more downside to come?
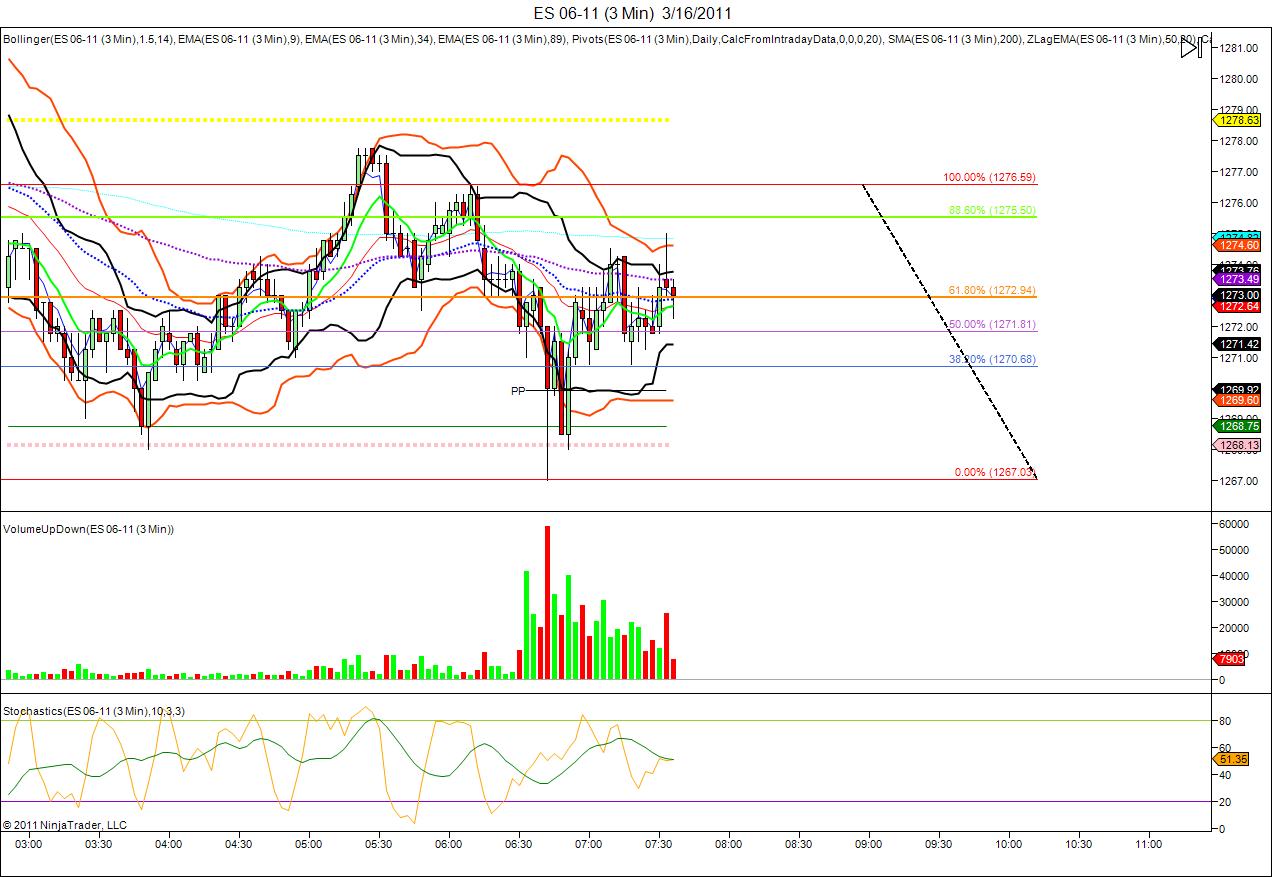
my 3 minute trade set up.
i have noticed if price bounces off the 38.20 fib line it will trace back up to the 88.6 level or close to it. i have a 4 point max profit but i am usually out in 2( my demons.. i get scared out of my own trades sometimes) If i think the trend or bias is up as i saw this morning, i take a long.. if i can see it is bearish.. i take a short. i use a 60 minute and 240 chart to hone in on trend and where i think price is heading. i thank lorn, bruce and KOOL for posing here so much if it wasn't for your guys, i would never even try to come up with my own strategy. i just wish i had the knowledge of volume and and s/r levels you guys do.
i have noticed if price bounces off the 38.20 fib line it will trace back up to the 88.6 level or close to it. i have a 4 point max profit but i am usually out in 2( my demons.. i get scared out of my own trades sometimes) If i think the trend or bias is up as i saw this morning, i take a long.. if i can see it is bearish.. i take a short. i use a 60 minute and 240 chart to hone in on trend and where i think price is heading. i thank lorn, bruce and KOOL for posing here so much if it wasn't for your guys, i would never even try to come up with my own strategy. i just wish i had the knowledge of volume and and s/r levels you guys do.
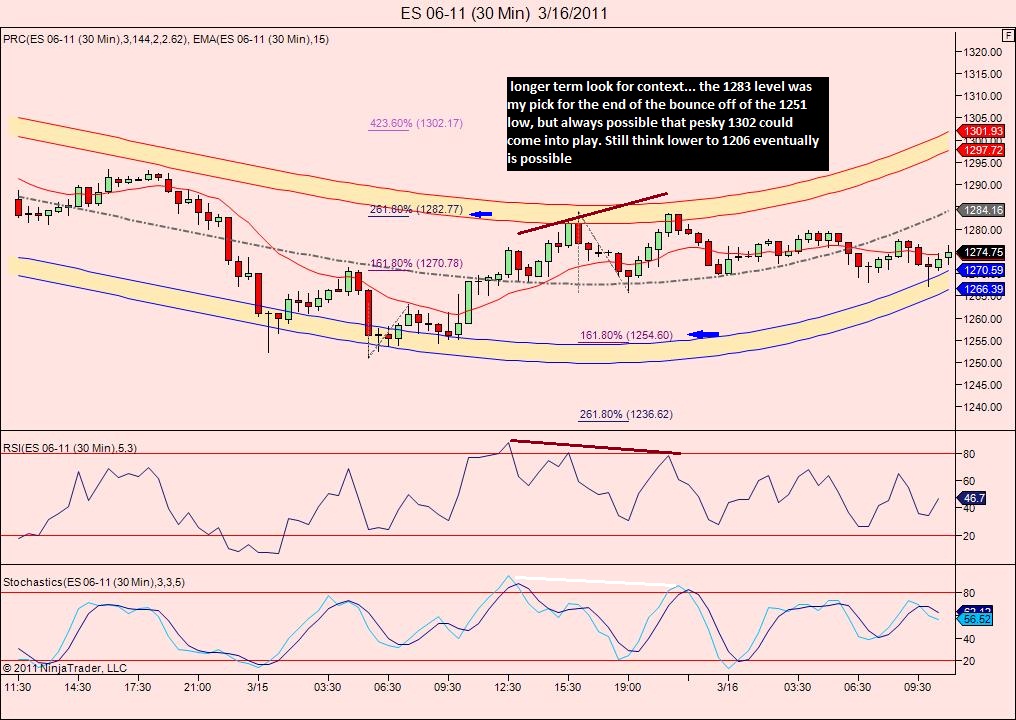
Good morning! looking for much lower prices in time, but thinking that todays strong seasonals may 'prop' the market up causing a sideways type environment... im keying in on the 1280.25 level for short scalps and the 1254.50 level for buys.. Avg range 25 handles ..(1280-1255?..that would be sweet!)
Originally posted by chrispI missed getting in, but looks like 15 min close above 72 was good signal, with good supp on test...
Originally posted by BruceMgood point Bruce, going by opening print I have 72, and the first 3 - 15 min candles have closed below
some beleive in an OR close which would be the closing minute of trade. IF you beleive that the opening range is defined by the one minute high and low like I do then it may pay to not get greedy and look at the closing range lows and highs on gap fills...
good little reactions there sometimes
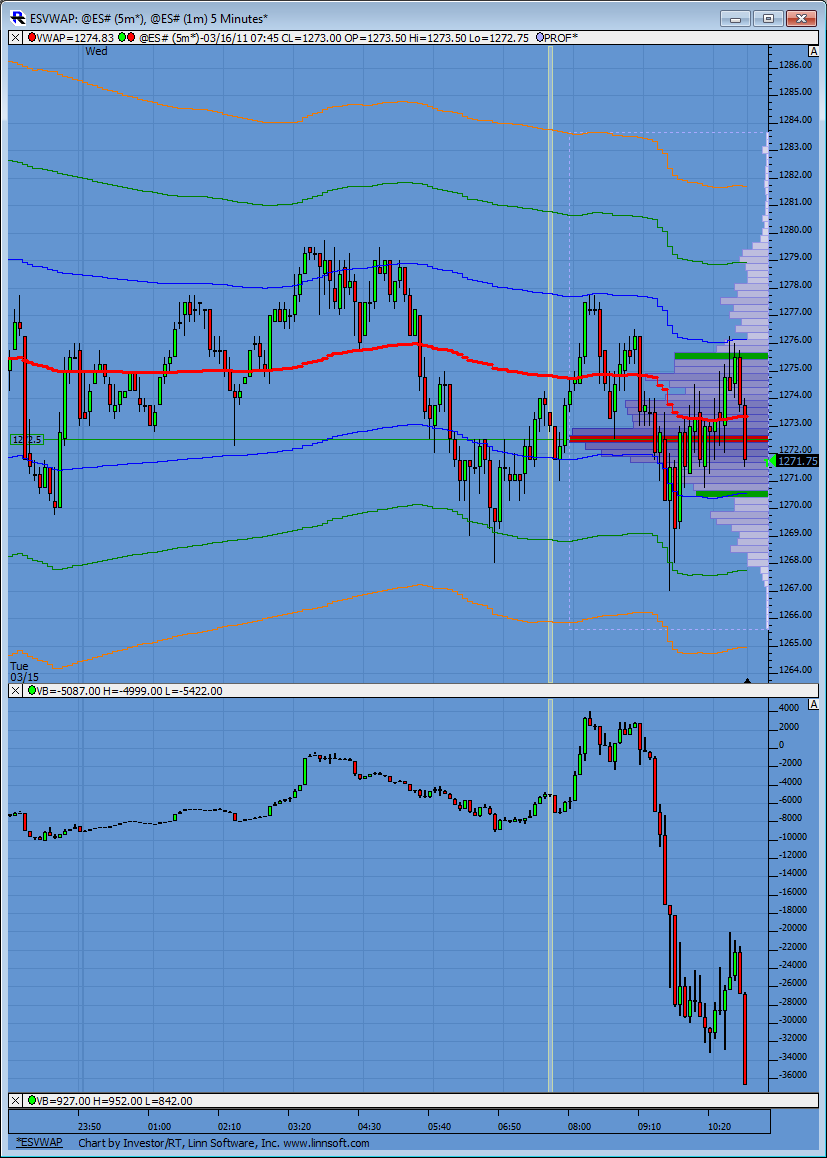
Almost 30K contracts entered at 1271.50. Not sure which way. M-Delta shows short
WOW!!!!! anyone have a clue on this drop??
Looks like news out of Japan military stepping in with reactors.
or this.
http://af.reuters.com/article/energyOilNews/idAFN1610498020110316?sp=true
or this.
http://af.reuters.com/article/energyOilNews/idAFN1610498020110316?sp=true
Originally posted by optimusprime
WOW!!!!! anyone have aclue on this drop??
DJ EU ENERGY CHIEF: SITUATION AT JAPAN NUCLEAR PLANT OUT OF CONTROL
DJ EU ENERGY CHIEF: POSSIBLE CATASTROPHIC EVENTS IN NEXT HOURS
DJ EU ENERGY CHIEF: POSSIBLE CATASTROPHIC EVENTS IN NEXT HOURS
BINGO...1255.50
look at that right down into that 47.50 in the O/N session......perfect magnet
Emini Day Trading /
Daily Notes /
Forecast /
Economic Events /
Search /
Terms and Conditions /
Disclaimer /
Books /
Online Books /
Site Map /
Contact /
Privacy Policy /
Links /
About /
Day Trading Forum /
Investment Calculators /
Pivot Point Calculator /
Market Profile Generator /
Fibonacci Calculator /
Mailing List /
Advertise Here /
Articles /
Financial Terms /
Brokers /
Software /
Holidays /
Stock Split Calendar /
Mortgage Calculator /
Donate
Copyright © 2004-2023, MyPivots. All rights reserved.
Copyright © 2004-2023, MyPivots. All rights reserved.
