ES Numbers for 3-01-11
key numbers
1335 - 1336 volume in O/N and O/N high - also an old gap there
1327.50 - volume from YD and O/N low - VA high too
1323 - 1322 - volume yesterday and weekly open
1319 - yesterdays low
1314.75 key volume from Friday and Sundays O/N session
Reports at 10 EST...trade with passion!!
\I prefer shorts for gap fill today as we have had two consecutive unfilled up gaps
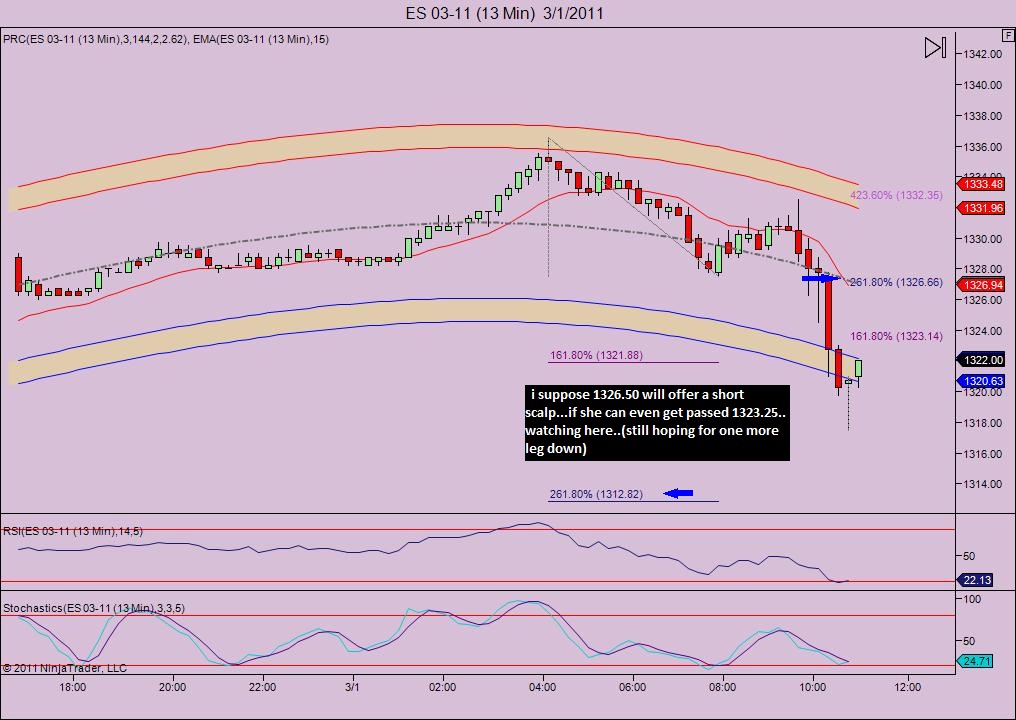
Yeah,P.T., my one min chart has the 2.618 projection at 1324.75, but im gambling that we get a touch more...
Bingo on 1325!!.. Your hot today ,P.T.!! LOL wish you were trading my account for me!
LOL
LOL
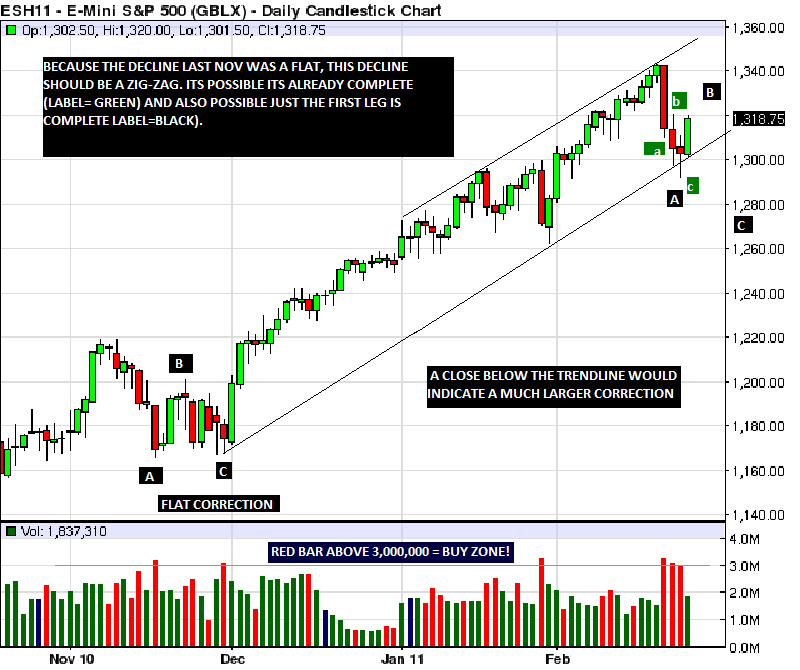
The reason im going with no sleep and watching today is this.. on the weekend preview i tried to show how 'normal' behavior would be one more leg down to form a zig-zag... the upside for 'b' that i had in mind was that 1334.50 area(hit today) . see the placement of the letter? and just using the one red bar at the peak gives around 1290 for the 1.618 (1292.50 achieved last week, and much freakin lower for the 2.618!.. After which, of course, much higher highs would be expected... anyway if that hourly channel does break id be getting nervousabout a possible leg down beginning. Just an opinion fwiw! btw, once again that 3 mill vol level worked pretty well!...
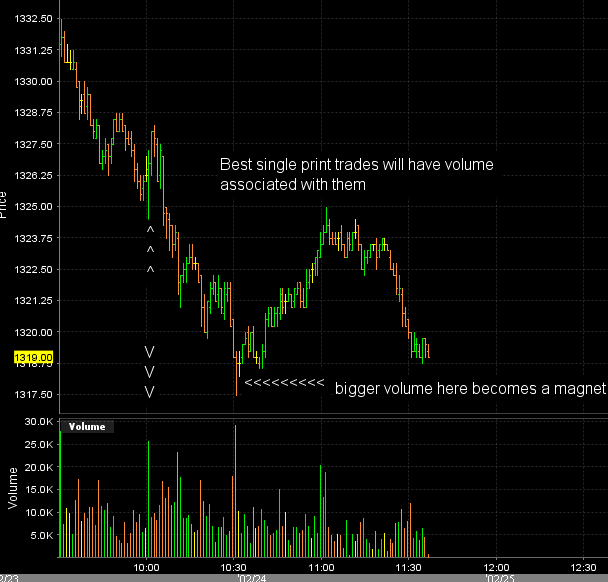
taking some lunch now but here is a good look at that area that formed the single prints PT mentioned. The very best single prints to take fades from will have volume associated with them. This makes sense as the volume push is what usually forms them or at least helps form them. The volume does not have to be at the exact area of the single prints but should be very close by. I put arrows on the chart to show the volume spike near 1325.
So here is the retest of the single print area (1325)and then the drive back down to test the even greater volume at our key number of 1319...
I'm not in this now but a failure to hold price here at the 1319 and new lows will go for that volume at the 1314.75 area...if the volume theory holds true.....
whats always fascinating about volume that is created vertically is that we often donot just blow through it without a bit of stalling and trade around the number. You can see how the 27.50 volume had some congestion at it today also. Just pointing that out. You can see what is happening at the 1319 number.
Well put, Bruce ... also note the 5 day avg range is 21.60 and 1336.50-21.60= VOILA!!! still think we might see that 1312.75-1313 tho
if we look at just the pure MP concepts from textbook teachings we have the open and drive day. Open outside of value that gets back in...we never tested the open print, Single prints have held the retrace......so not a very bullish structure today so far.....a trending structure....DOWN !!!..lets see if reality matches the textbook....
Originally posted by koolblue.... still looking for 1312.75-1313.00... 1313.50 hit so far! one min mini low due about 4 min or so
Yeah,P.T., my one min chart has the 2.618 projection at 1324.75, but im gambling that we get a touch more...
There it is.. i may regret this but now long from 1313.00...
the biggest volume number generated from today falls at the 1317.50 - 1318.25 area...there are also single prints that haven't filled in yet at the same spot which gets back to the idea I mentioned earlier
Emini Day Trading /
Daily Notes /
Forecast /
Economic Events /
Search /
Terms and Conditions /
Disclaimer /
Books /
Online Books /
Site Map /
Contact /
Privacy Policy /
Links /
About /
Day Trading Forum /
Investment Calculators /
Pivot Point Calculator /
Market Profile Generator /
Fibonacci Calculator /
Mailing List /
Advertise Here /
Articles /
Financial Terms /
Brokers /
Software /
Holidays /
Stock Split Calendar /
Mortgage Calculator /
Donate
Copyright © 2004-2023, MyPivots. All rights reserved.
Copyright © 2004-2023, MyPivots. All rights reserved.


