ES weekend preview 2-26-11
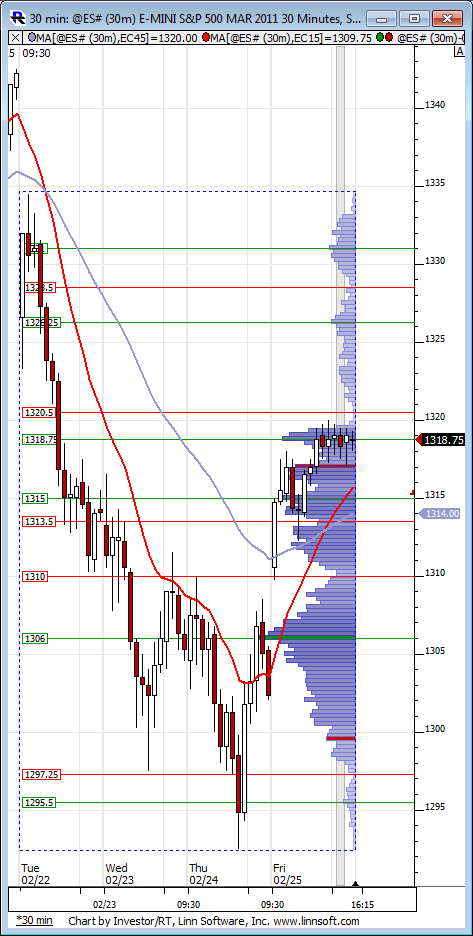
We finally got the pullback that i, and pretty much every analyst in the free world, had expected! From last weekends preview...Here are Mike Burke’s comment on the Feb 2007 mini- Crash: “In late February 2007 (3rd year of the Presidential Cycle, 4 years ago) all of the major indices hit multi year highs confirmed by everything that matters. From that point the major indices fell, for no apparent reason 5% – 9% in a week. These things happen in strong markets and I do not know how to predict them. What I do know is the market has always recovered from a decline off a confirmed high fairly quickly so they are buying opportunities." Spot on i'd say! Now ,however, there are very good reasons why the correction could be complete, and even more(imho) why there may be more to come! On the bullish side,the 'normal' 3 day 3% plus correction whenever we had 11 consecutive days with the close above the open (only 3 times in history)... correction so far in the cash index = 3.7%. And courtesy of sentimentrader:" When we've seen this in the past, using either S&P 500 futures or the S&P 500 SPDR (SPY), prices rebounded between 75% - 90% of the time from 2 days through 2 weeks later, with a risk/reward that was skewed about 3-to-1 to the reward side.
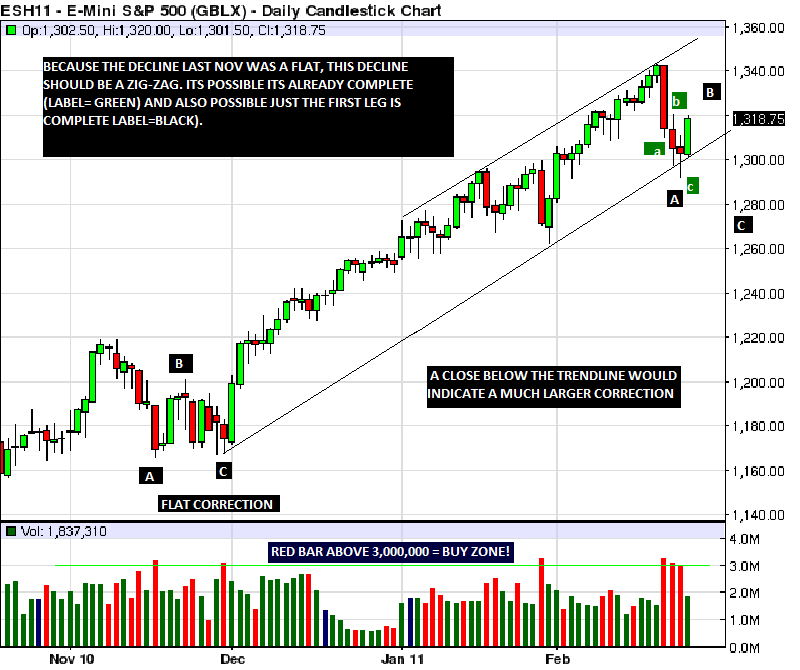
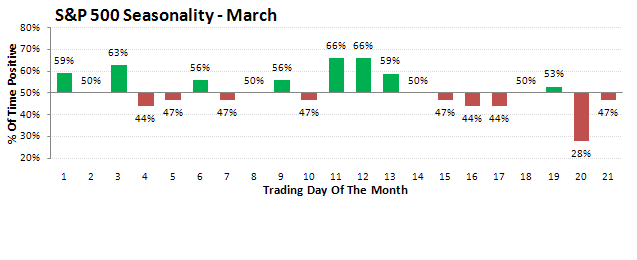
Using SPY prices, it took a median of 8 trading days for the S&P to close at a new 52-week high, with 8 of the 10 instances taking less than 13 days." Well, weve rebounded 2 days so far, and new highs may not be too far away (8-13 days total). For me, the divergence in breadth at the recent highs, and lagging new highs,and general wave stucture,are strong reasons to suspect new lows ahead first. At any rate, the march to 1426 minimum should continue eventually. Here is a look at thewave stucture, then monthly seasonals, followed by the historical tendancies by % postive and then % return....
...
the two studies above are courtesy sentimentrader. The next good Kools tools turn point is 3/7. Hopefully all of these charts will be of some help to your trading biases, but as always, price action rules! Good trading all!
Hello Kool!
....Glad to see you're still here...and glad to see you are trading the currencies.
That's where I've been the last 20 months or so -- mostly trading the EURUSD, GBPUSD and spot gold, and, still using some of your methods with considerable success!
....Glad to see you're still here...and glad to see you are trading the currencies.
That's where I've been the last 20 months or so -- mostly trading the EURUSD, GBPUSD and spot gold, and, still using some of your methods with considerable success!
Emini Day Trading /
Daily Notes /
Forecast /
Economic Events /
Search /
Terms and Conditions /
Disclaimer /
Books /
Online Books /
Site Map /
Contact /
Privacy Policy /
Links /
About /
Day Trading Forum /
Investment Calculators /
Pivot Point Calculator /
Market Profile Generator /
Fibonacci Calculator /
Mailing List /
Advertise Here /
Articles /
Financial Terms /
Brokers /
Software /
Holidays /
Stock Split Calendar /
Mortgage Calculator /
Donate
Copyright © 2004-2023, MyPivots. All rights reserved.
Copyright © 2004-2023, MyPivots. All rights reserved.


