ES Short Term Trading 02-24-2011
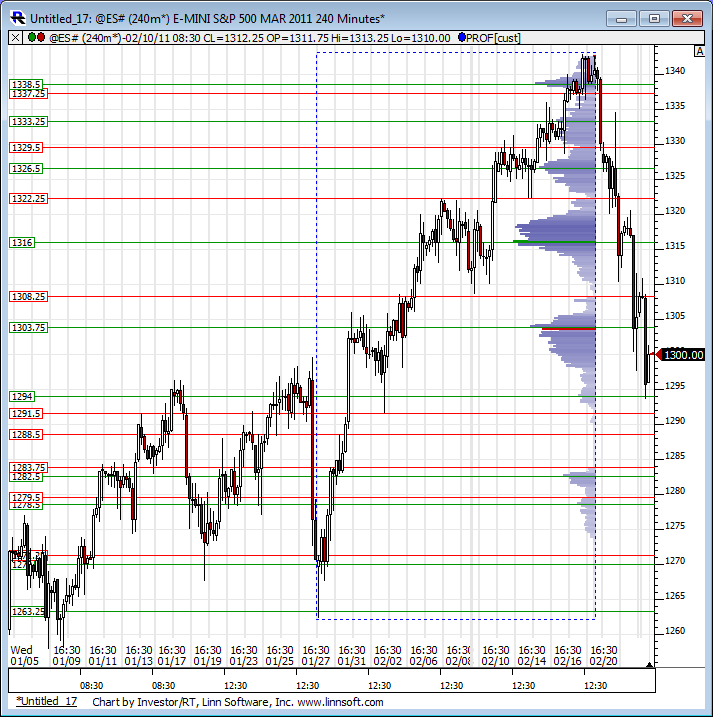
Thought it would be helpful to draw a profile on the move up from the January low to see where the volume was in that move.
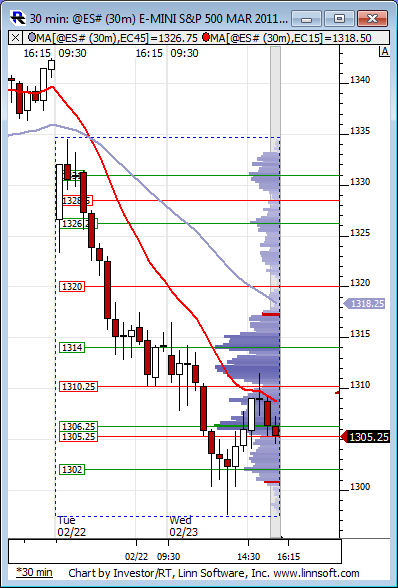
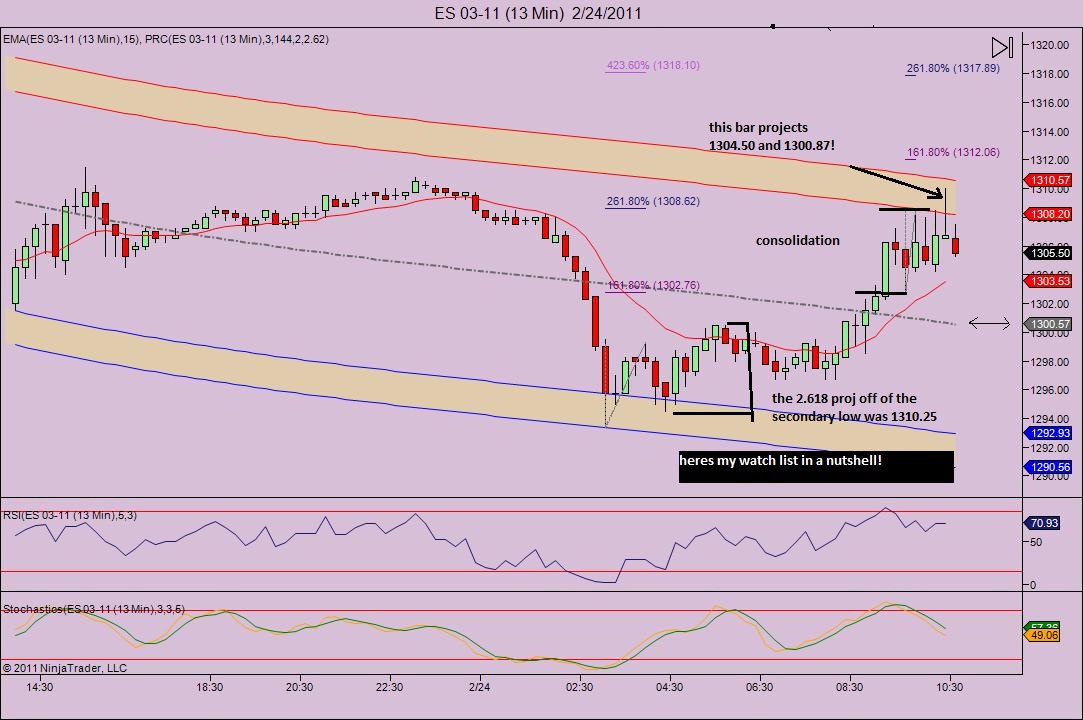
Good morning! Had a terrific overnite seeion ,but as i hate after the fact posts i wont comment except to say my charts yesterday had me looking for 1295and we hit 1293.50 (indicating lower later?) . i made good bucks on a long scalp.... so the rebound is finally upon us.. im expecting it to be somewhat short lived tho.. currently watching 1308.50 and 1301.50
resistances above would be 1312.00-1312.50, then 1314.25 the measured move from the breakout of ths recent consolidation(1302.75 to 1308.50) and then 1317.75, the current 13 min proj to 1318.25 (the 4.236 from 1293.50) ps 1310 is the 2.618 from last nites secondary low of 1294.50...hope this helps.... by the way, i had my order earlier to sell at 1308.50, but never got a fill! grrrr
Trading Days High Low Range Range % Average Range Average Range % Close % New High New Low Average Volume
5 1343.00 1297.50 45.50 3.5% 17.00... this is how i knew 1310 (at a minimum) would likely be seen!...17 plus 1393.50= 1310.50!...btw, going below 1295.25 last nite indicates lower prices in the future for me ,anyway... Bears would have to be targetting 1389 and change charts later if necessary
5 1343.00 1297.50 45.50 3.5% 17.00... this is how i knew 1310 (at a minimum) would likely be seen!...17 plus 1393.50= 1310.50!...btw, going below 1295.25 last nite indicates lower prices in the future for me ,anyway... Bears would have to be targetting 1389 and change charts later if necessary
Originally posted by koolbluesorry bout the typo!...1289 and change!...
Trading Days High Low Range Range % Average Range Average Range % Close % New High New Low Average Volume
5 1343.00 1297.50 45.50 3.5% 17.00... this is how i knew 1310 (at a minimum) would likely be seen!...17 plus 1393.50= 1310.50!...btw, going below 1295.25 last nite indicates lower prices in the future for me ,anyway... Bears would have to be targetting 1389 and change charts later if necessary
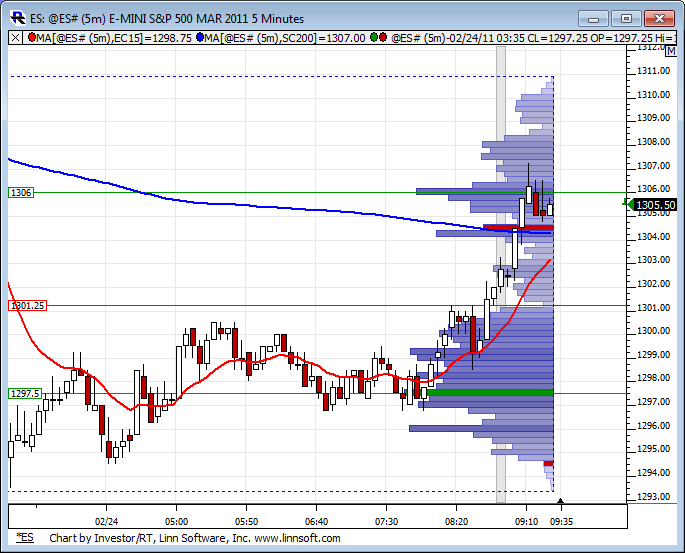
selling here! 1304.50
filled short at 1304.25...red avg on the 5 min is 1305.25 and falling
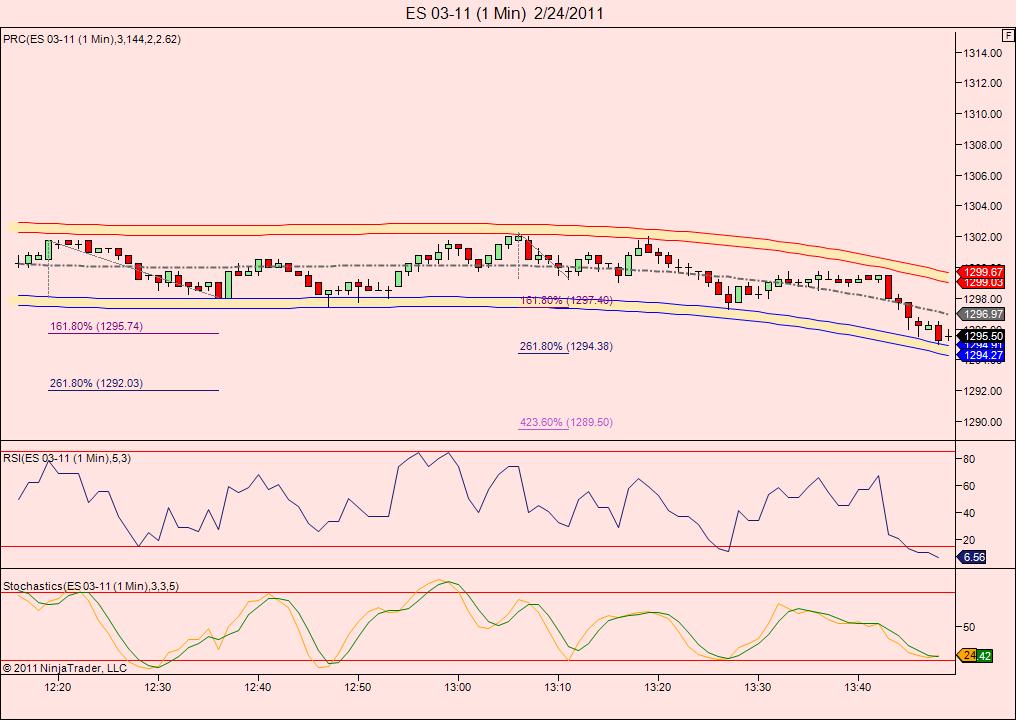
Thats for sure!..at least i got a few handles ouuta them!.. Herea one min chart cause it has the numbers to watch! ..dont forget the hourly wants 1283!... gotta get some sleep!..
Emini Day Trading /
Daily Notes /
Forecast /
Economic Events /
Search /
Terms and Conditions /
Disclaimer /
Books /
Online Books /
Site Map /
Contact /
Privacy Policy /
Links /
About /
Day Trading Forum /
Investment Calculators /
Pivot Point Calculator /
Market Profile Generator /
Fibonacci Calculator /
Mailing List /
Advertise Here /
Articles /
Financial Terms /
Brokers /
Software /
Holidays /
Stock Split Calendar /
Mortgage Calculator /
Donate
Copyright © 2004-2023, MyPivots. All rights reserved.
Copyright © 2004-2023, MyPivots. All rights reserved.
