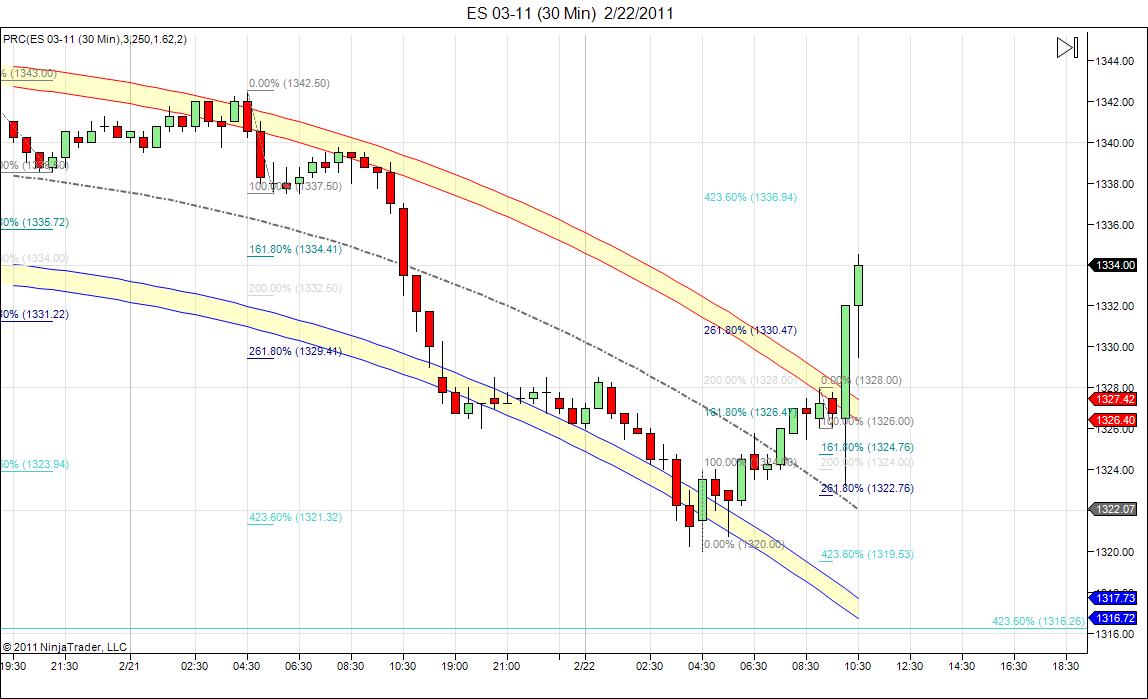
ES short term trading 2/22/11
From the weekend preview:
Besides the fact that sentiment is flat to negative this week, sentimentrader reports that the day after Presidents day (Tues) has been positive only 36% of the time. They also note that the only 3 times the s&p cash had a close higher than the open (11 days in a row) ..."That's an incredible streak that has been seen only 3 other times in the contract's nearly 30-year history.
The others were 1/8/92, 8/30/93 and 9/14/95. Interestingly, each time the futures topped out during the next few days, and lost around 3% maximum during the next three weeks."... So again this week , there are good sentiment and historical reasons to be cautious here.Add to that the fact that the last couple days of the month have been bearish ,at least for the last 7 months or so, and Stock traders almanac reports the Dow has been down the last 9 OF THE LAST 12 times the week after Feb expiration. Of course ,so far, this market has defied most historical considerations. Remember Feb was usually a lousy month! I do note however, that recently the small cap leaders, are beginning to lag! (sp up 1% last week, nas up .9%) . I place a lot of importance on this! So, in summary, a little pullback can come at anytime now ,but a decent one is probably , a ways off yet!
Originally posted by koolbluechickened out at this stall... took 1326.25 for my exit..plus 2.75 on the runner. Nice beginning , but be advised that last night i had the misfortune to buy at 1329.50 and got stopped at 1327.50 for a 4 handle hit!(2 es) so now im up but only half a handle!BEATS BEING DOWN I GUESS!LOL
Took one off at 1325.25,plus 1.75 there . holding the other for the 1326.50 upper band on the one min chart...
The stage is now set,imho! Now ,we'll see how much cajones this uber bullish market has!.. we either tank to new lows (1216-17?) or proceed to 1333 with a pause at 1330.50. I have to be careful on entering a position as i have to run momma to the dentist in about 40 min, but this next hour could be fun!
Originally posted by koolblue..Bingo! (trying to sell 1333.50! ugh!)
The stage is now set,imho! Now ,we'll see how much cajones this uber bullish market has!.. we either tank to new lows (1216-17?) or proceed to 1333 with a pause at 1330.50. I have to be careful on entering a position as i have to run momma to the dentist in about 40 min, but this next hour could be fun!
short from 1333.50, but this has to be a quick scalp for me!
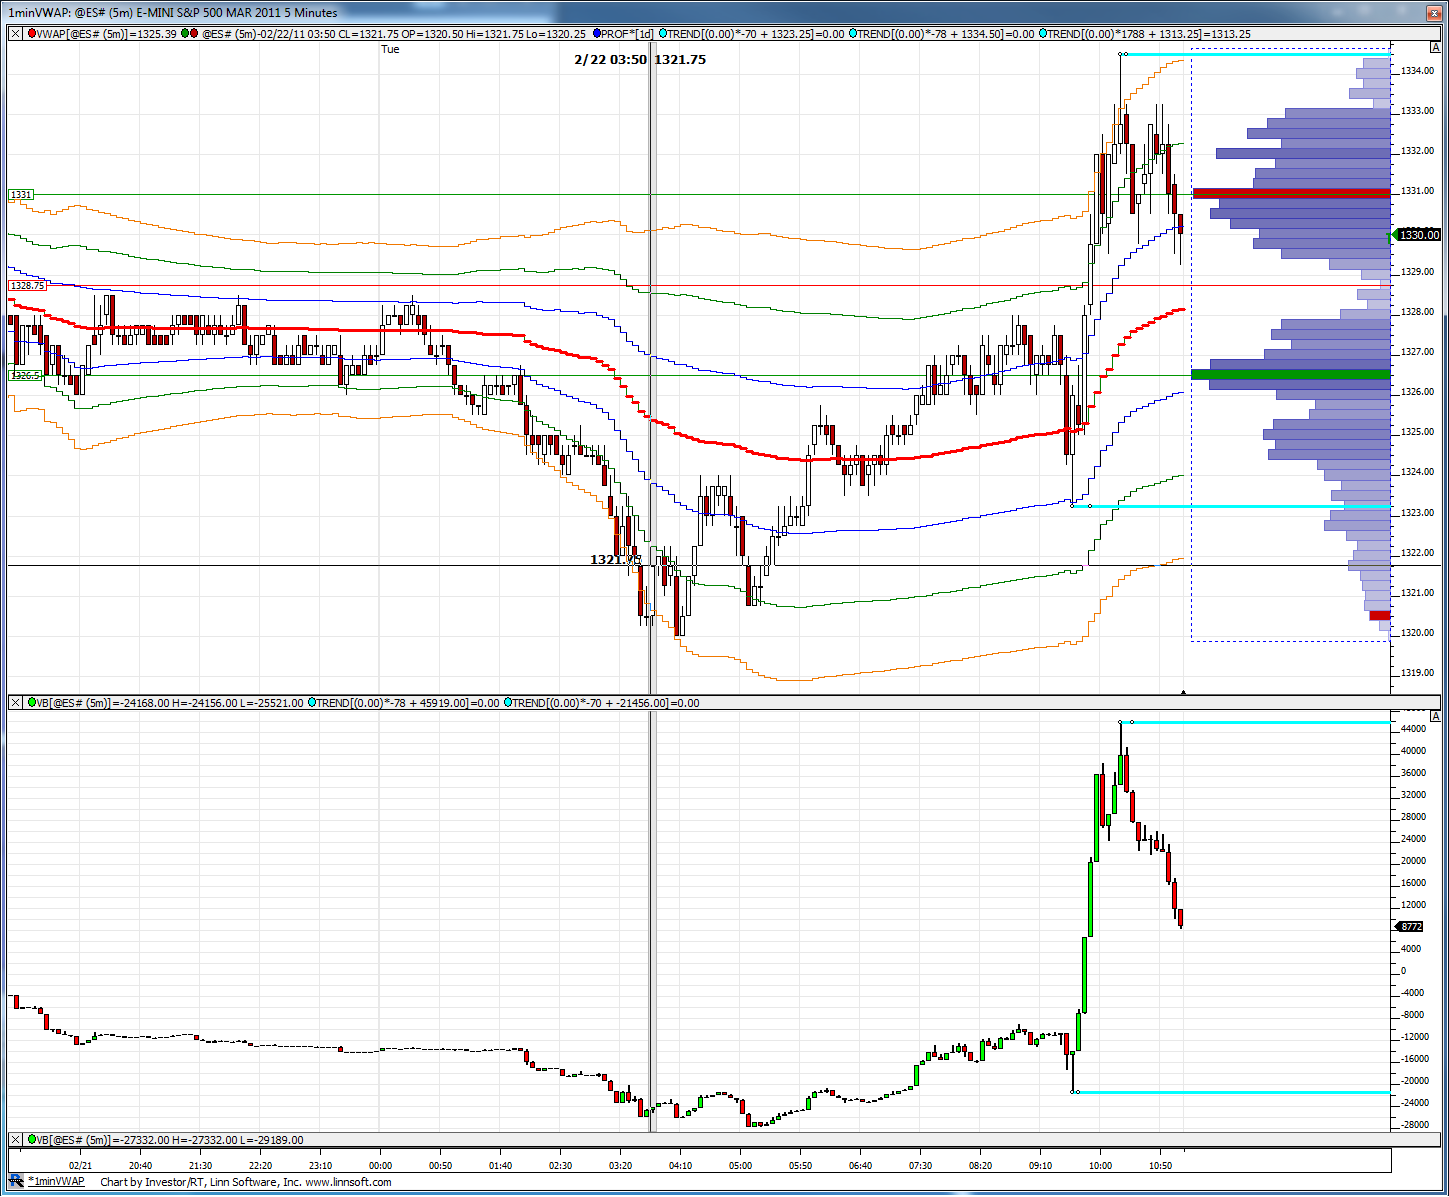
I'm thinking we might get a bigger extension up Kool. The fact that 1336.25 is the low from Friday's RTH session sets up well with that projection and prices have now found support on a breakout from the O/N high at 1330.25.
Anything is possible though.
Anything is possible though.
i'll take 1332.00 if im lucky.. gotta run soon! ugh!
Thank you ,Lord .. out at 1332.00 plus 1.5 on 2 es, now up 3.5 on the day... see ya soon!
VWAP chart with 1st hour H/L's marked with light blue lines on both price and CD. Will be very interesting which side of this range is challenged first. If price can stay above the VWAP line here might be an indication the highs will be challenged first.
Lorn, regarding your 10:21 post... in all fairness i also,at that point , thought it likely we could advance further. I thought the 1333.50 level was a good short scalp and in fact it proved to be.. Now the 64000 dollar question, is this 1320 retest enough for the bulls?
TICK has been decisively negative today. I'm letting that lead my hand for now.
well too late in the day for me!.. one min proj is 1311.00, hourly is 1310.75.. Good luck all! c ya!
Emini Day Trading /
Daily Notes /
Forecast /
Economic Events /
Search /
Terms and Conditions /
Disclaimer /
Books /
Online Books /
Site Map /
Contact /
Privacy Policy /
Links /
About /
Day Trading Forum /
Investment Calculators /
Pivot Point Calculator /
Market Profile Generator /
Fibonacci Calculator /
Mailing List /
Advertise Here /
Articles /
Financial Terms /
Brokers /
Software /
Holidays /
Stock Split Calendar /
Mortgage Calculator /
Donate
Copyright © 2004-2023, MyPivots. All rights reserved.
Copyright © 2004-2023, MyPivots. All rights reserved.

