ES short term trading 2-09-11
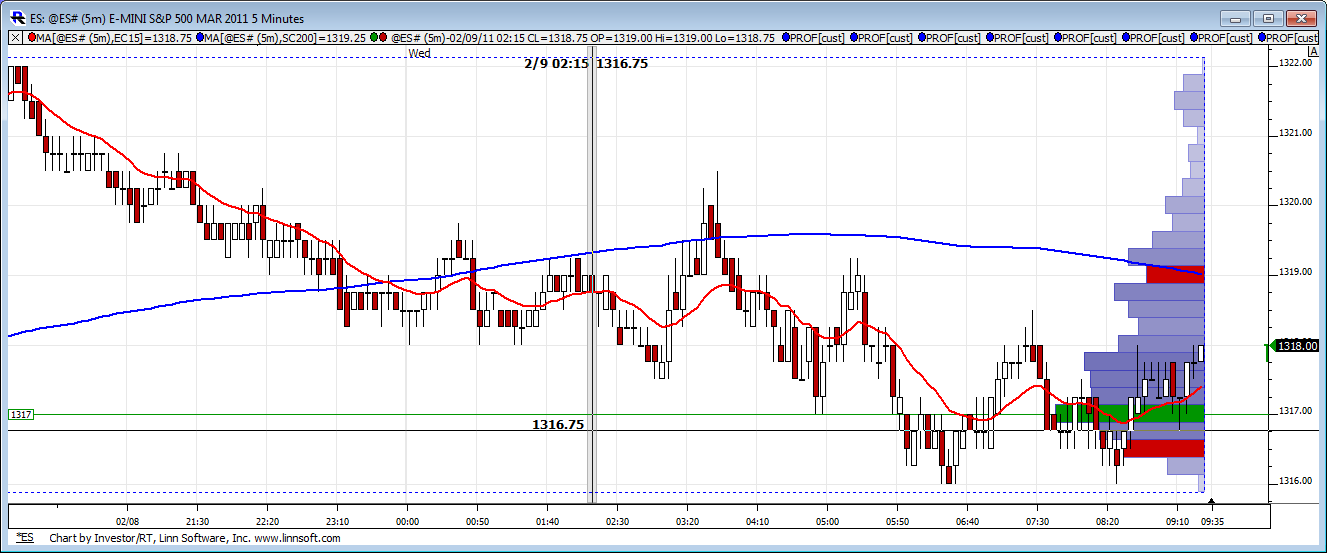
Looking at 1315 - 1317 as critical support today...this would include the VA low, the current O/N low and for the biggest reason is that 1315. Yesterday that had all the big one minute spike volume so somebody was interested in defending that.....so a real key number. When a market doesn't come back for a retest of volume like I was expecting it to do yesterday, then I will keep track of that volume point. So 1315 is that point!!
Below there is the 1308 - 1310 that includes mondays open print and the high of last week !!
On the upside is the secondary Volume of the 1320 prints...so a key number..
Even though we have a gap above to use as a target I'd prefer looking for shorts on any brief rally up today. We had lots of divergences on the way up yesterday that seems to point to a tired market for this week.
It is also unusual to not have a retest of a weekly high...so last weeks high at 1308 is a giant magnet....just not sure if today is the day.......we've had an extended weekly run so it would be odd to just keep going up this week without that retest..
Good trading today
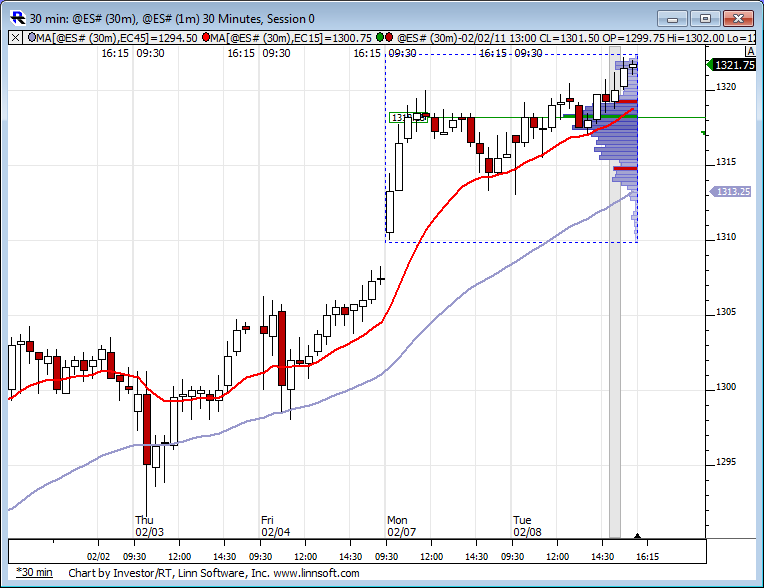
Here is the weeks developing RTH profile. I find it extremely interesting to see the bell curve present in what most people would probably describe as a trending week so far.
hmmmm.......
hmmmm.......
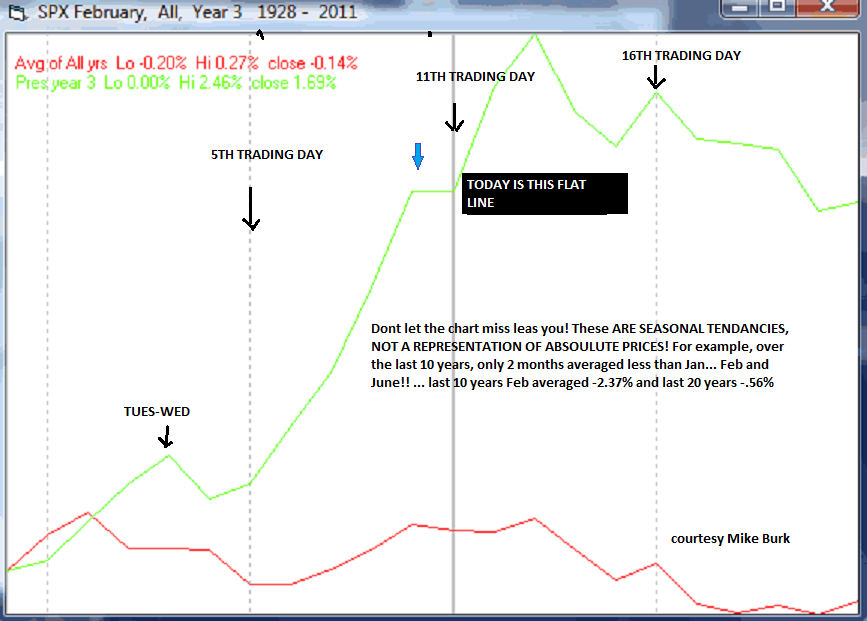
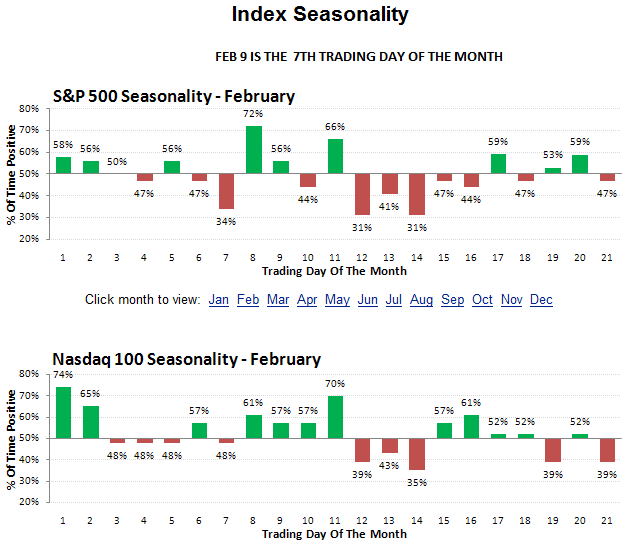
Good morning... Well, yesterday was fun . Today seasonally and historically should be a down day , so i'm thinking any surge to new highs would likely be sold. Still doing my homework (just woke up!) but im would think yesterdays resistance of 1322.50-1323.25. and 1329 still applies...
For all these reasons (seasonally flat, historically very negative, projections ) i have a sell in at 1322.50
I know what you mean Kool...had the same order. Those are the ins and outs of trading.
Well, learned my lesson there! stopped at 1315.50.loss of 1.5 on 2 es..down 3 on the day...ugh!
Trips left on the board down at 1315.25 which just happens to be one tick below the VPOC for the day.
Originally posted by BruceM
yes Lorn..I'm guessing it's gonna be even steven from the open print or even higher possibly above triples.....but this is outta my time frame....just watching to see if they can close it at 3:30 above the O/N low...we gotta remember it's still a neutral day
Emini Day Trading /
Daily Notes /
Forecast /
Economic Events /
Search /
Terms and Conditions /
Disclaimer /
Books /
Online Books /
Site Map /
Contact /
Privacy Policy /
Links /
About /
Day Trading Forum /
Investment Calculators /
Pivot Point Calculator /
Market Profile Generator /
Fibonacci Calculator /
Mailing List /
Advertise Here /
Articles /
Financial Terms /
Brokers /
Software /
Holidays /
Stock Split Calendar /
Mortgage Calculator /
Donate
Copyright © 2004-2023, MyPivots. All rights reserved.
Copyright © 2004-2023, MyPivots. All rights reserved.


