MP Early signs of consolidation turned into trend
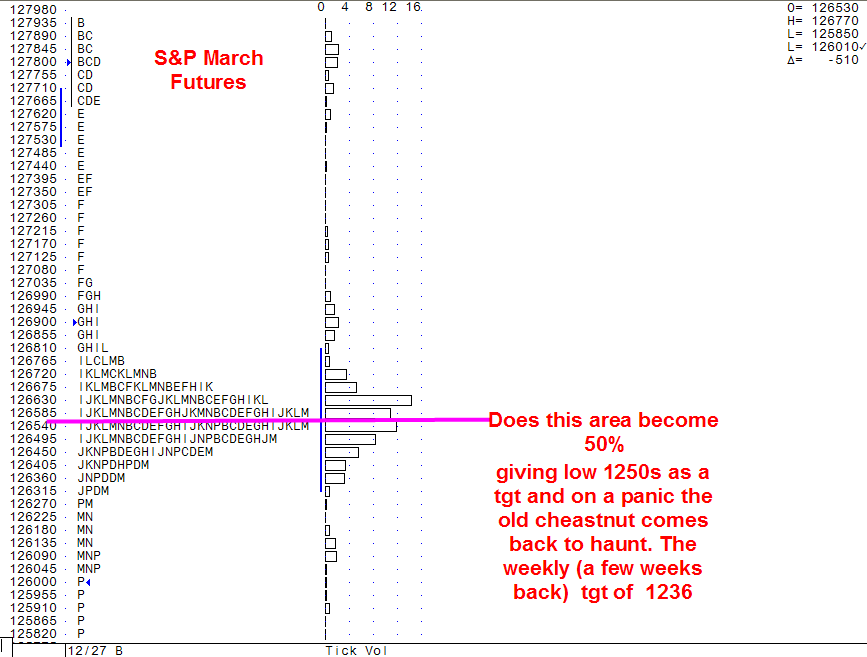
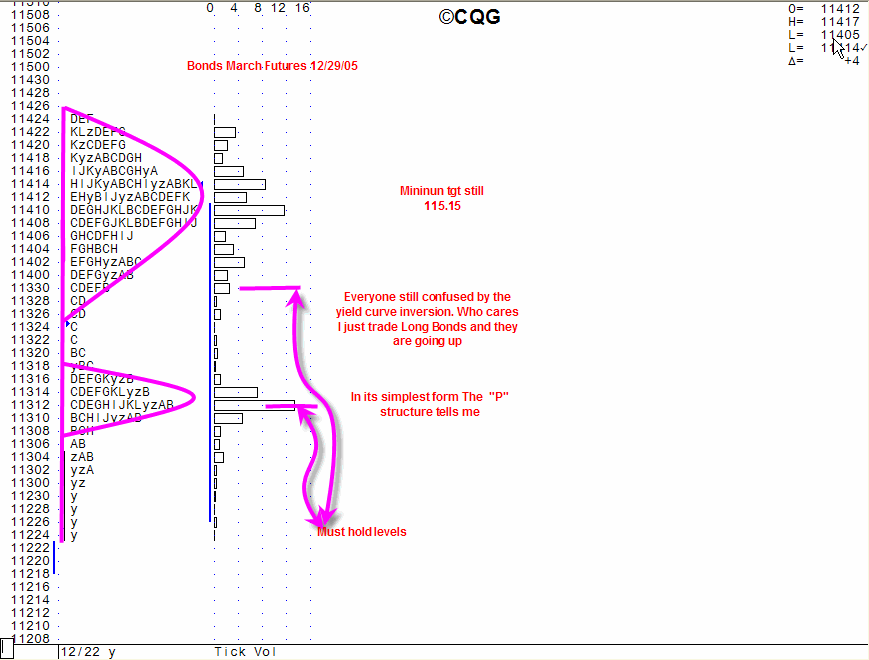
Alex: We also have a P structure/pattern/shape left over from today's trading in the ES. Do you not also consider this bullish like you mentioned in the Bond summary?
[1267.75] D
[1267.50] D [DVAH]
[1267.25] DGK
[1267.00] DGKM
[1266.75] DGHJKMN
[1266.50] DEGHIJKMN
[1266.25] DEFGHIJKLMN
[1266.00] DEFGHIJKLMNP [DPOC]
[1265.75] DEFGIJKLMNP
[1265.50] DEFGIJLMNP
[1265.25] DEFGIJLMP
[1265.00] EFGIJP
[1264.75] EFGP
[1264.50] FP
[1264.25] FP
[1264.00] FP
[1263.75] FP
[1263.50] P
[1263.25] P
[1263.00] P [DVAL]
[1262.75] P
[1262.50] PQ
[1262.25] PQ
[1262.00] PQ
[1261.75] PQ
[1261.50] PQ
[1261.25] PQ
[1261.00] PQR
[1260.75] PQR
[1260.50] PQR
[1260.25] R
[1260.00] R
[1259.75] R
[1259.50] R
[1259.25] R
[1259.00] R
[1258.75] R
[1258.50] R
The answer was given by the lower value both on this day and the next. For your P structure to have gained any degree of weight we would have had to have regained at least 1264. It shows yet again that we still don t actually have any shorts in the market as evidenced by the lack of lift and the rotation lower. The market is trying to find out WHERE the buyer is. For the slightly longer term Now I m sure that we will start the New Year with an attempt to rotate higher to try to squeeze the shorts but in reality who kept a position over the turn of the year or if they did was it not hedged? So much happening in January. Bk of England, European Central Bank,Both early then later FOMC. We get some early January data but the real trends this year likely to manifest themselves post March 31st.
Have you guys ever tried to use volume at price charts from chartex [url]http://www.chart-ex.com/[/url]. Has it worked in tandem with MP Charts or helped in taking trading decision. Can you post corresponding volume charts from Chartex alongside your MP charts? I think it might be interesting.
Regards
MARK
Regards
MARK
Mark,
Good question. I think that the Chart-Ex charts are a very valuable tool and I think that they will become more important in the future. I was talking to the owner of Chart-Ex today and learned that CTI data is also available on those charts.
I have yet to put a Chart-Ex volume at price chart alongside an MP chart but there is very little doubt that the shape will be very similar.
I'm still having some problems with these charts but if it works when you look at them then it should also save the selections that you make.
While looking at any of those charts, if you hold down the shift key and right click the mouse on the chart you will see the values being displayed on the line change from volume -> CTI 1 -> CTI 2 -> CTI 3 -> CTI 4 etc.
I'll keep you posted as I discover more about the relationship between these charts.
first time I ve seen chartx. i like the ability to be able to click for the CTi cat. at each price directly on the chart rather than the way I currently do it which is to access the raw data direct from the CBOT
If the owner of chart-ex has her way then I think that we're in for a treat in the future as I believe that there will be some even more useful charts and tools on her site in the future.
quote from Daytrader
"While looking at any of those charts, if you hold down the shift key and right click the mouse on the chart you will see the values being displayed on the line change from volume -> CTI 1 -> CTI 2 -> CTI 3 -> CTI 4 etc."
Pardon me for my ignorance, what does CTI 1->CTI 2 etc denote. While I checking chartex(E-mini SP) I did not see any change in value for CT1 1,2,3,4. Please could you explain in breif what is CTI?
Thanks
Mark
CTi catorigaries are the following:
CTi1= Floor traders/ locals/ these days the day trading arkades
CTi2= Commercials Prop. or house accounts
CTi3= Other exchange memebrs filling orders on behalf of Other Exchange members. IE Man filling an order for Goldman
CTi4= Spec. accounts like you and me/ Any other type of customer not falling into the above. This used to be a bit of a dump account but now since Dec 2004 has been cleaned up by CBOT because the CFTC told all the exchanges to clean up the data. It NOW HAS TO BE MONITORED because it is as I said not only the Joe Public positions but is ALSO the Hedge Funds and CTAs
The data is accessible from the LDB which unfortunately is expensive (imho) but can be had for free on a weekend by accessing Don Jones website. FOr the links go to my website (currently shut until Jan 15th for maintenance ahead of a relaunch as a members only site) and in the MarketProfile page there are all the links you could possivbly wamt to Don Jones Cisco-Futures site including the link to the LDB weekend free data access.
Thank you very much allelyb for the explanation. That was some useful information. Thanks for the links. I will surely take a look at.
Thank you again.
Mark
Thanks Alex - I am about to say that I didn't know that but as soon as I'd read what you said I remembered someone else telling me that - forgot. Thanks for putting us straight.
Emini Day Trading /
Daily Notes /
Forecast /
Economic Events /
Search /
Terms and Conditions /
Disclaimer /
Books /
Online Books /
Site Map /
Contact /
Privacy Policy /
Links /
About /
Day Trading Forum /
Investment Calculators /
Pivot Point Calculator /
Market Profile Generator /
Fibonacci Calculator /
Mailing List /
Advertise Here /
Articles /
Financial Terms /
Brokers /
Software /
Holidays /
Stock Split Calendar /
Mortgage Calculator /
Donate
Copyright © 2004-2023, MyPivots. All rights reserved.
Copyright © 2004-2023, MyPivots. All rights reserved.

